

Issue 16 of The Pointer Index · Function focus · Week ending 2 August 2026
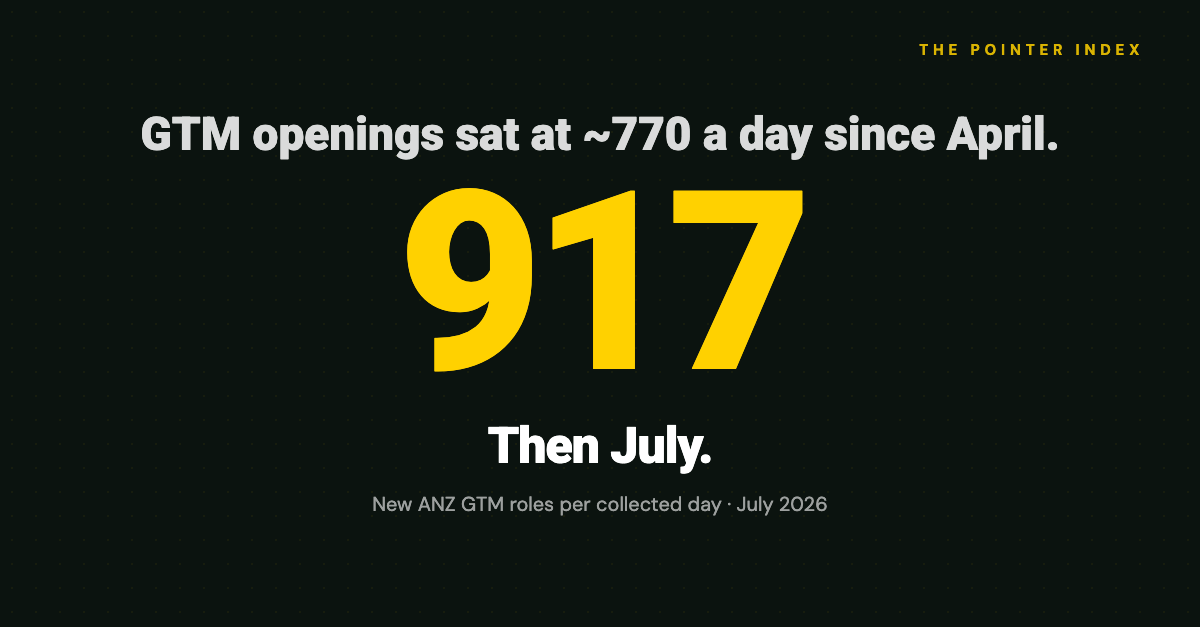
ANZ employers opened more go-to-market roles in July than in any month we have tracked. The rate had barely moved since April. In July it broke.
This is the week-one function focus. One index, five numbers, one observation.
The numbers
How big, and how sure
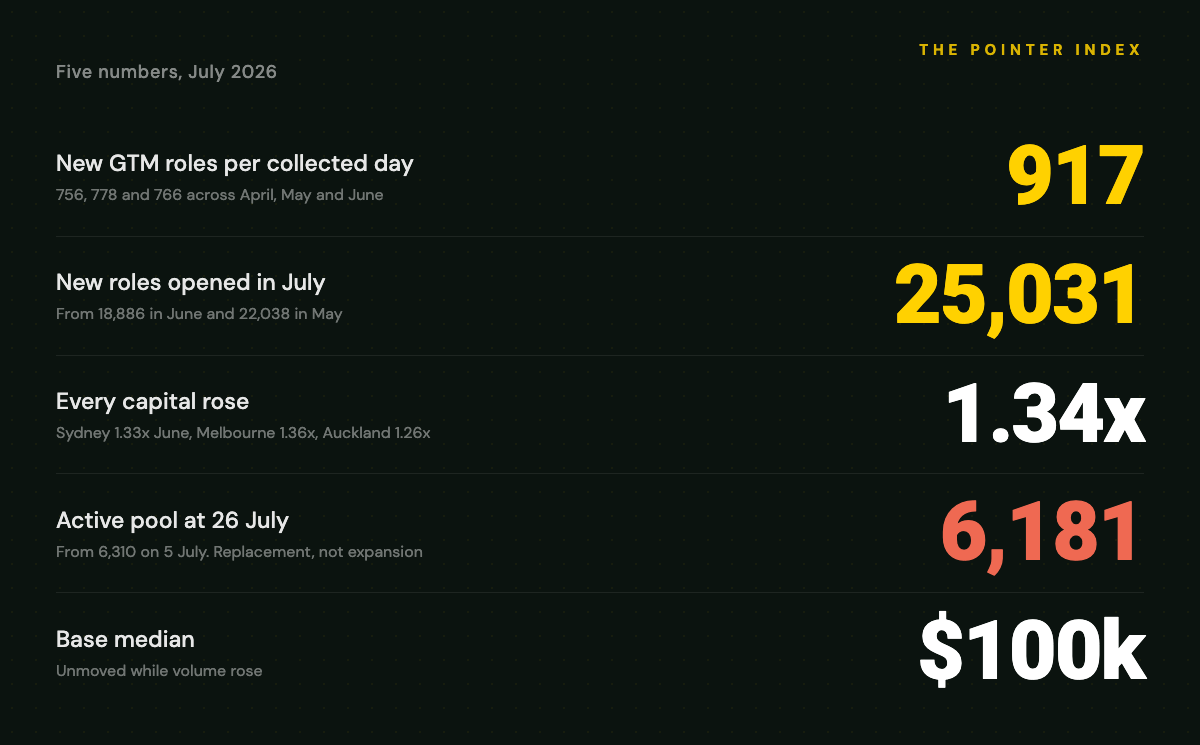
Three months of near-identical readings is what makes July worth writing about. From 12 April to the end of June the market opened between 756 and 778 GTM roles on every day we collected, a band of about 3%. July came in at 917, roughly a fifth above the top of it.
The lift is everywhere. No capital city sat outside the range of 1.20 to 1.39 times its June volume, and the overall figure is 1.34. Nothing is carrying this alone, which is what a calendar effect looks like rather than one industry booming. The obvious candidate is the Australian financial year turning over on 1 July and headcount budgets opening at once. We cannot prove that from listings, so treat it as the likely reading rather than a finding.
Two things we are not counting. April's first eleven days ran at 935 a day because the tracker was still capturing the roles that were already open when it switched on, so that stretch is warm-up rather than hiring and we exclude it. And June lost two days of collection outright, which is why we compare daily rates rather than monthly totals.
More openings, roughly the same market
The pool of open roles ended the month at 6,181, down from 6,310 on 5 July. Record openings, and slightly fewer roles standing open at the end of it.
That is replacement, not expansion. Employers are cycling roles faster rather than adding to the stock, and if you are hiring it means you competed against more ads for the same size of market. The base median did not move to meet it, holding at $100,000.
What July paid
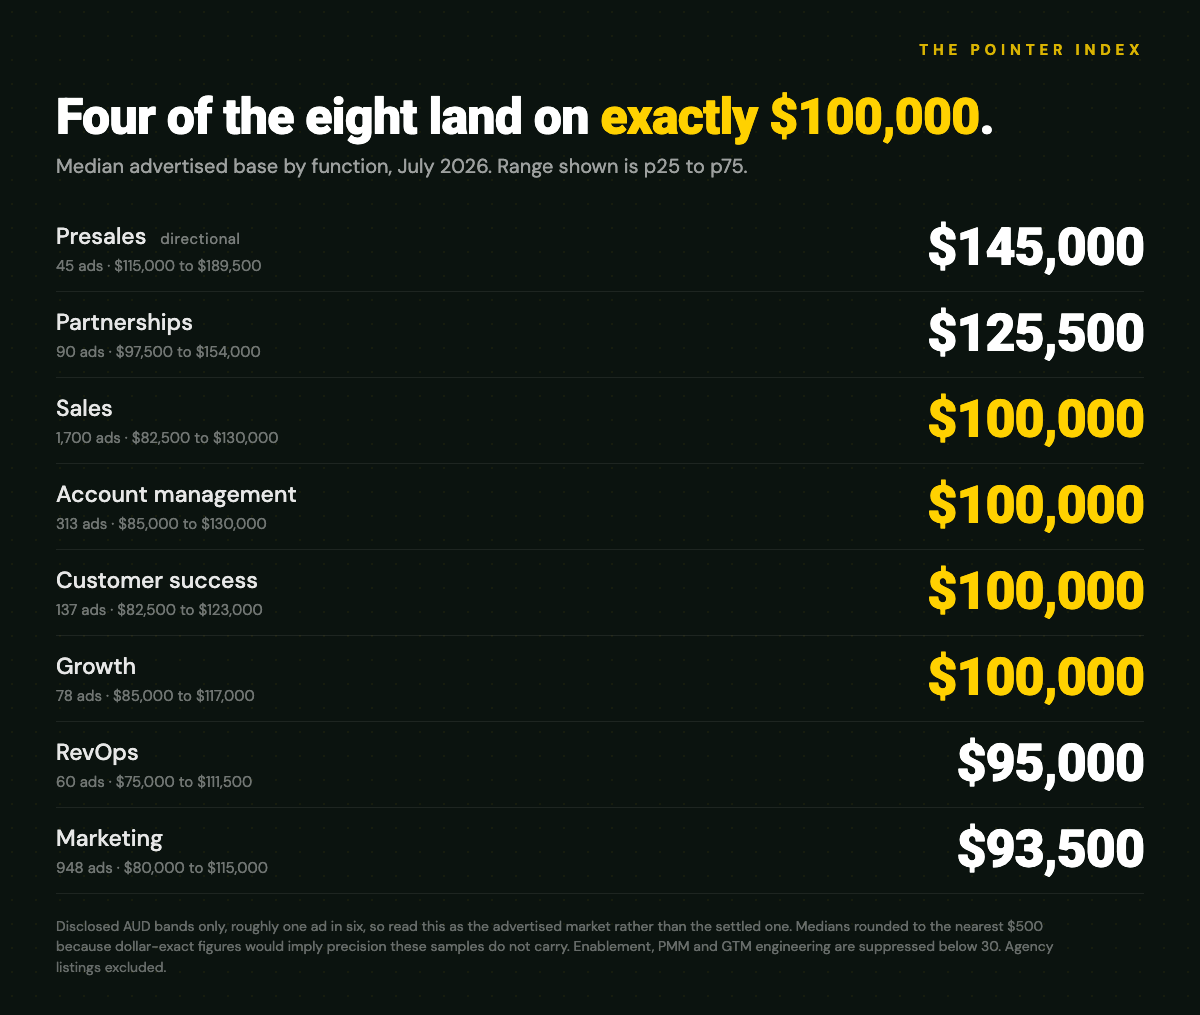
| Function | Ads with a band | p25 | Median | p75 |
|---|---|---|---|---|
| Presales *(directional)* | 45 | $115,000 | $145,000 | $189,500 |
| Partnerships | 90 | $97,500 | $125,500 | $154,000 |
| Sales | 1,700 | $82,500 | $100,000 | $130,000 |
| Account management | 313 | $85,000 | $100,000 | $130,000 |
| CS | 137 | $82,500 | $100,000 | $123,000 |
| Growth | 78 | $85,000 | $100,000 | $117,000 |
| RevOps | 60 | $75,000 | $95,000 | $111,500 |
| Marketing | 948 | $80,000 | $93,500 | $115,000 |
Four of the eight land on exactly $100,000. The anchor is not a sales number, it is the market's number.
The AI line is parked
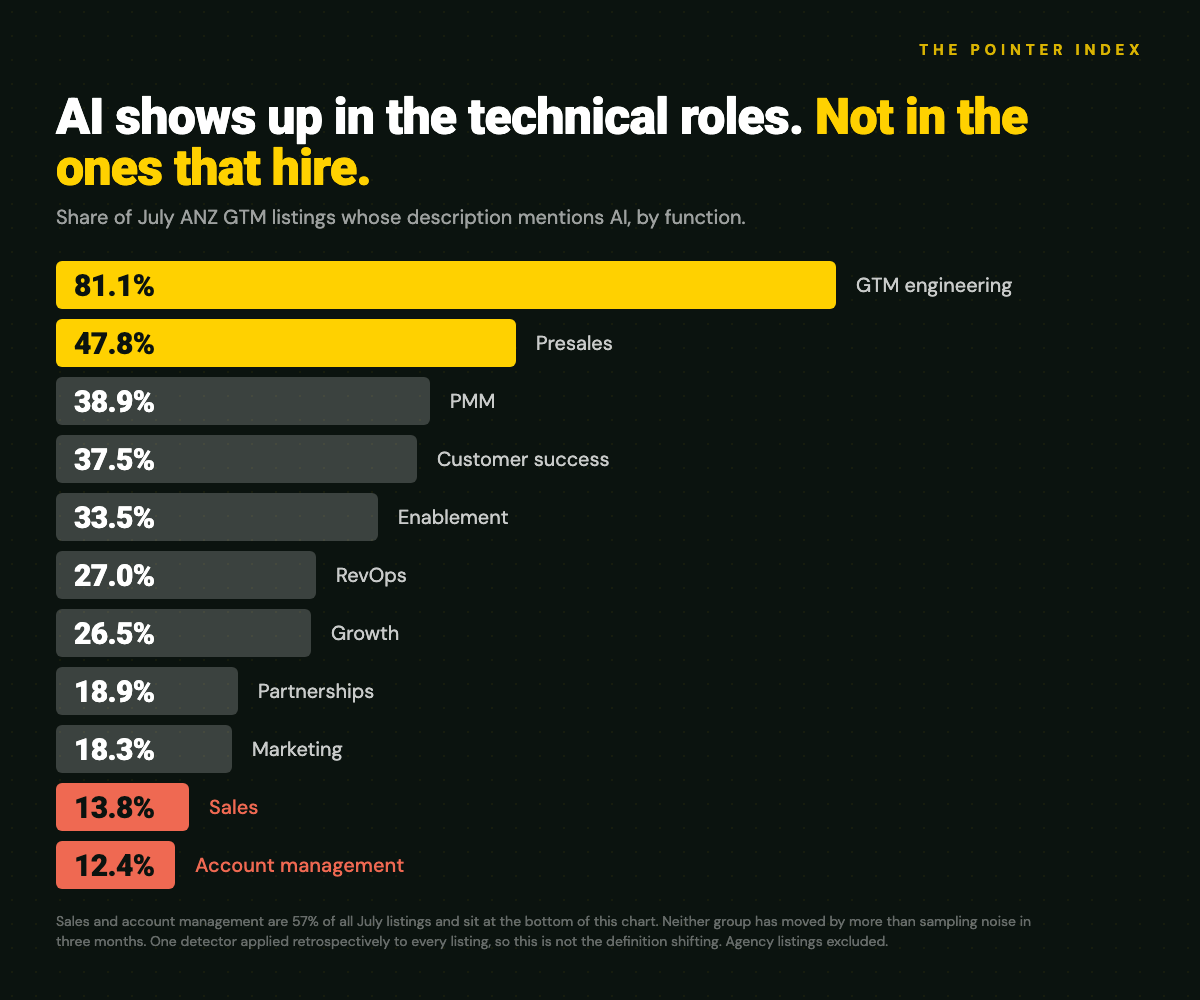
Worth noting because it did not move with the volume. Sales and account management are 57% of July's ads and mentioned AI in 13.5% of them, against 13.1% in June and 13.2% in May. The technical functions sat at 37.5%, from 39.2% and 38.5%. Neither group has moved by more than sampling noise in three months, and the gap between them has not closed: GTM engineering mentions AI in 81% of ads, sales in 14%.
The AE deal
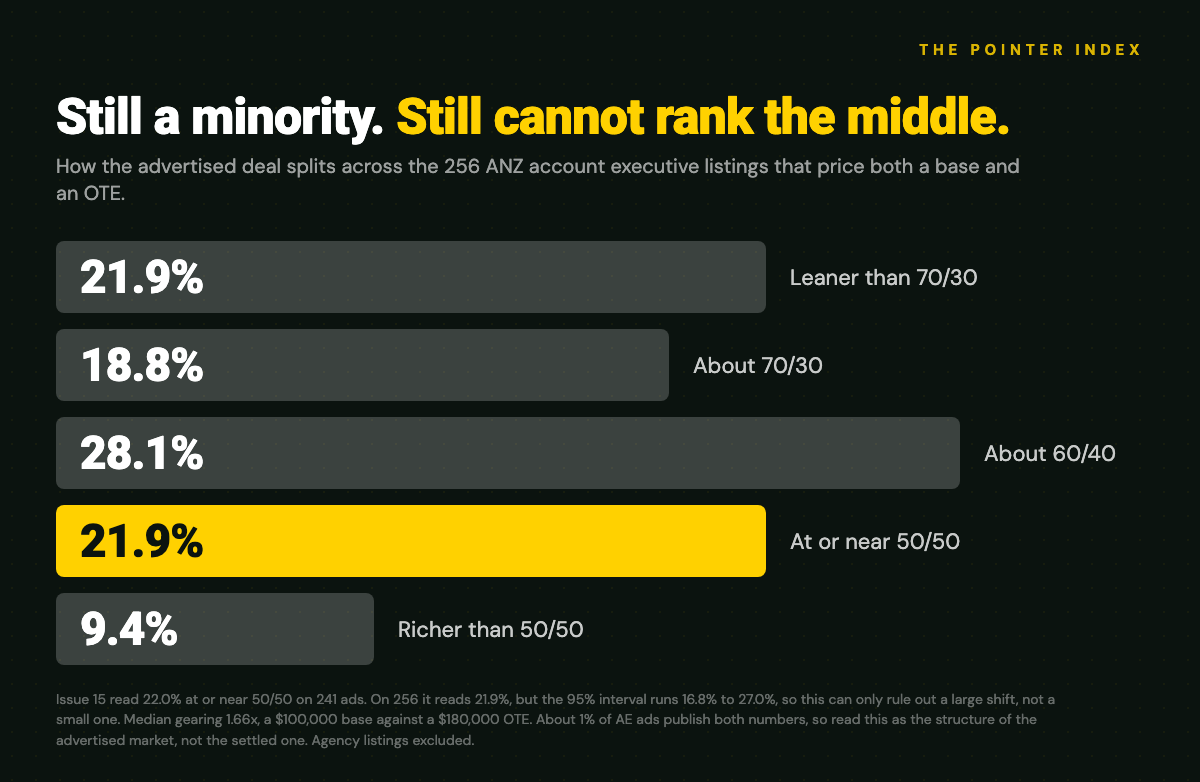
| Advertised split | Share |
|---|---|
| Leaner than 70/30 | 21.9% |
| About 70/30 | 18.8% |
| About 60/40 | 28.1% |
| At or near 50/50 | 21.9% |
| Richer than 50/50 | 9.4% |
Last issue called 50/50 a minority on 241 priced ads. On 256 we still cannot detect a change, though on a sample this size that is a weak test: the band sits anywhere from 17% to 27%. Median gearing 1.66x, a $100,000 base against a $180,000 OTE.
Correction
We named three rising functions last issue with five days of July still to run. Presales and revops do not survive the full month: both sat at ordinary levels through April and May, and only looked like rises because we measured from an unusually low week. Growth holds, though part of its move is our own classifier reassigning ecommerce roles into it.
New standing rule, so this does not recur: we will not call a monthly trend before the month closes.
One number to watch next month
917 new roles a day. A single month above a band that held for three is a candidate, not a trend. If August holds above 850 the financial-year reading stands and the market has genuinely stepped up. If it falls back to the high 700s, July was a budget-cycle spike.
The short version
ANZ go-to-market employers opened 917 new roles per collected day in July 2026, the highest rate since tracking began, and 25,031 roles in total. The rate had been flat for three months, running at 756 a day from 12 to 30 April, 778 in May and 766 in June, a band of roughly 3%. July sits about a fifth above it. The lift was broad rather than concentrated: every capital city recorded between 1.20 and 1.39 times its June volume, with Sydney at 1.33, Melbourne 1.36, Brisbane 1.32, Perth 1.34 and Auckland 1.26, against 1.34 overall. The most likely explanation is the Australian financial year turning over on 1 July and headcount budgets opening at once, though that cannot be proven from listings alone. Despite the record openings, the pool of roles standing open fell from 6,310 in the week ending 5 July to 6,181 in the week ending 26 July, so employers replaced roles faster than they added to the stock. Median advertised base pay did not move, landing on exactly $100,000 in four of the eight publishable functions.
*Built from live ANZ data and updated continuously on the Pointer market data dashboard.*
*The small print. Monthly figures group listings by the calendar month we first saw them, not by reporting week. Volume is reported per collected day because collection is not uniform: April has 26 days with data, May 31, June 28 and July 30, and days below 200 listings are excluded from the daily average (2 in May, 4 in June, 3 in July). Raw monthly totals are 22,554, 22,038, 18,886 and 25,031 new non-agency GTM listings for April through July. The daily rates are 867 for April as a whole, 778, 766 and 917; April splits into 935 a day across 1 to 11 April and 756 a day from 12 to 30 April, and we use the later figure as April's comparable rate. The tracker turned on in the week ending 5 April, so the opening stretch records roles that were already open rather than newly opened, and treating it as hiring would overstate April. That three months then land within 3% of each other on very different collection coverage is also the strongest evidence that the per-day measure is not an artefact of missing days: June, the worst-collected month, is not the outlier.*
*On the pool. Both pool readings are fully collected weeks. We deliberately do not quote the week ending 2 August: collection on 1 and 2 August recorded 45 and 272 new roles against roughly 600 to 650 on comparable weekend days, and that shortfall depresses the stock as well as the flow. Only 317 roles in that week's pool came from its final two days, against 647, 650 and 660 in the three weeks before it, so the 2 August reading understates the pool by roughly 330 and is not a safe basis for a monthly comparison. Issue 15 measured July against the weeks ending 28 June and 26 July; this issue measures 5 July to 26 July, which is why the endpoints differ between the two issues. No published week has ever been recomputed; the index is insert-only by design.*
*On the AI metric. Computed with an immutable word-boundary detector run retrospectively against the raw description of every listing, so all months are measured on one definition. This deliberately differs from the AI figure in the weekly index, which had definition changes on 8 and 24 June. Multi-character terms match case-insensitively; bare "AI" and "ML" match case-sensitively so "email" and "html" do not count. It measures a mention, not a confirmed skill requirement. The technical group is presales, revops, enablement, PMM, GTM engineering, CS and growth: 3,762 July listings against 14,388 in sales and account management, and 2,279 against 11,640 in June. On those samples the June to July change in each group is well inside sampling error, which is what "no detectable movement" means here; it is not a claim that the true rate is identical.*
*On the salary table. July listings only, non-agency, medians of the midpoint of each advertised AUD band, rounded to the nearest $500 because dollar-exact figures would imply precision these samples do not carry. Published from 50 or more disclosed bands, labelled directional between 30 and 50, suppressed below 30: presales at 45 is directional and enablement, PMM and GTM engineering are suppressed. Disclosed bands are roughly one ad in six.*
*On the AE table. ANZ non-agency listings classified as account executive where our extraction found both an advertised base and an advertised OTE, drawn from the whole corpus rather than the active pool, n=256. Sanity bounds: base $40,000 to $500,000, OTE $40,000 to $1,000,000, OTE at or above base, ratio at or below 4x. Figures use advertised maximums where a range was given. "At risk" is the variable share of the deal, (OTE minus base) divided by OTE. Bands are a variable share under 25%, 25% to under 35%, 35% to under 45%, 45% to 55% inclusive, and above 55%. The 95% interval around the 21.9% figure runs from 16.8% to 27.0%, so this table can only rule out a large shift, not a small one. About 1% of AE ads publish both numbers, which is the largest caveat here.*
*Methodology. "GTM" means Sales, Account Management, Marketing, CS, Presales, RevOps, Enablement, Partnerships, Growth, PMM, and GTM Engineering. Numbers come from live ANZ job listings scraped from public records. Recruitment agency listings are excluded throughout. Market-index figures are point-in-time snapshots at the close of the reporting week, recorded in an insert-only weekly index that is never recomputed. We publish the size of the active pool rather than a monthly net, because a listing that closes and later reposts has its closing date cleared, so weekly opening and closing counts overstate turnover and do not sum to the change in the pool. The live dashboard updates continuously and may differ slightly. The tracker turned on in the week ending 5 April 2026. If a number looks wrong, reply to the newsletter or contact us. Corrections run in the next issue.*