

Issue 13 of The Pointer Index · Week ending 12 July 2026
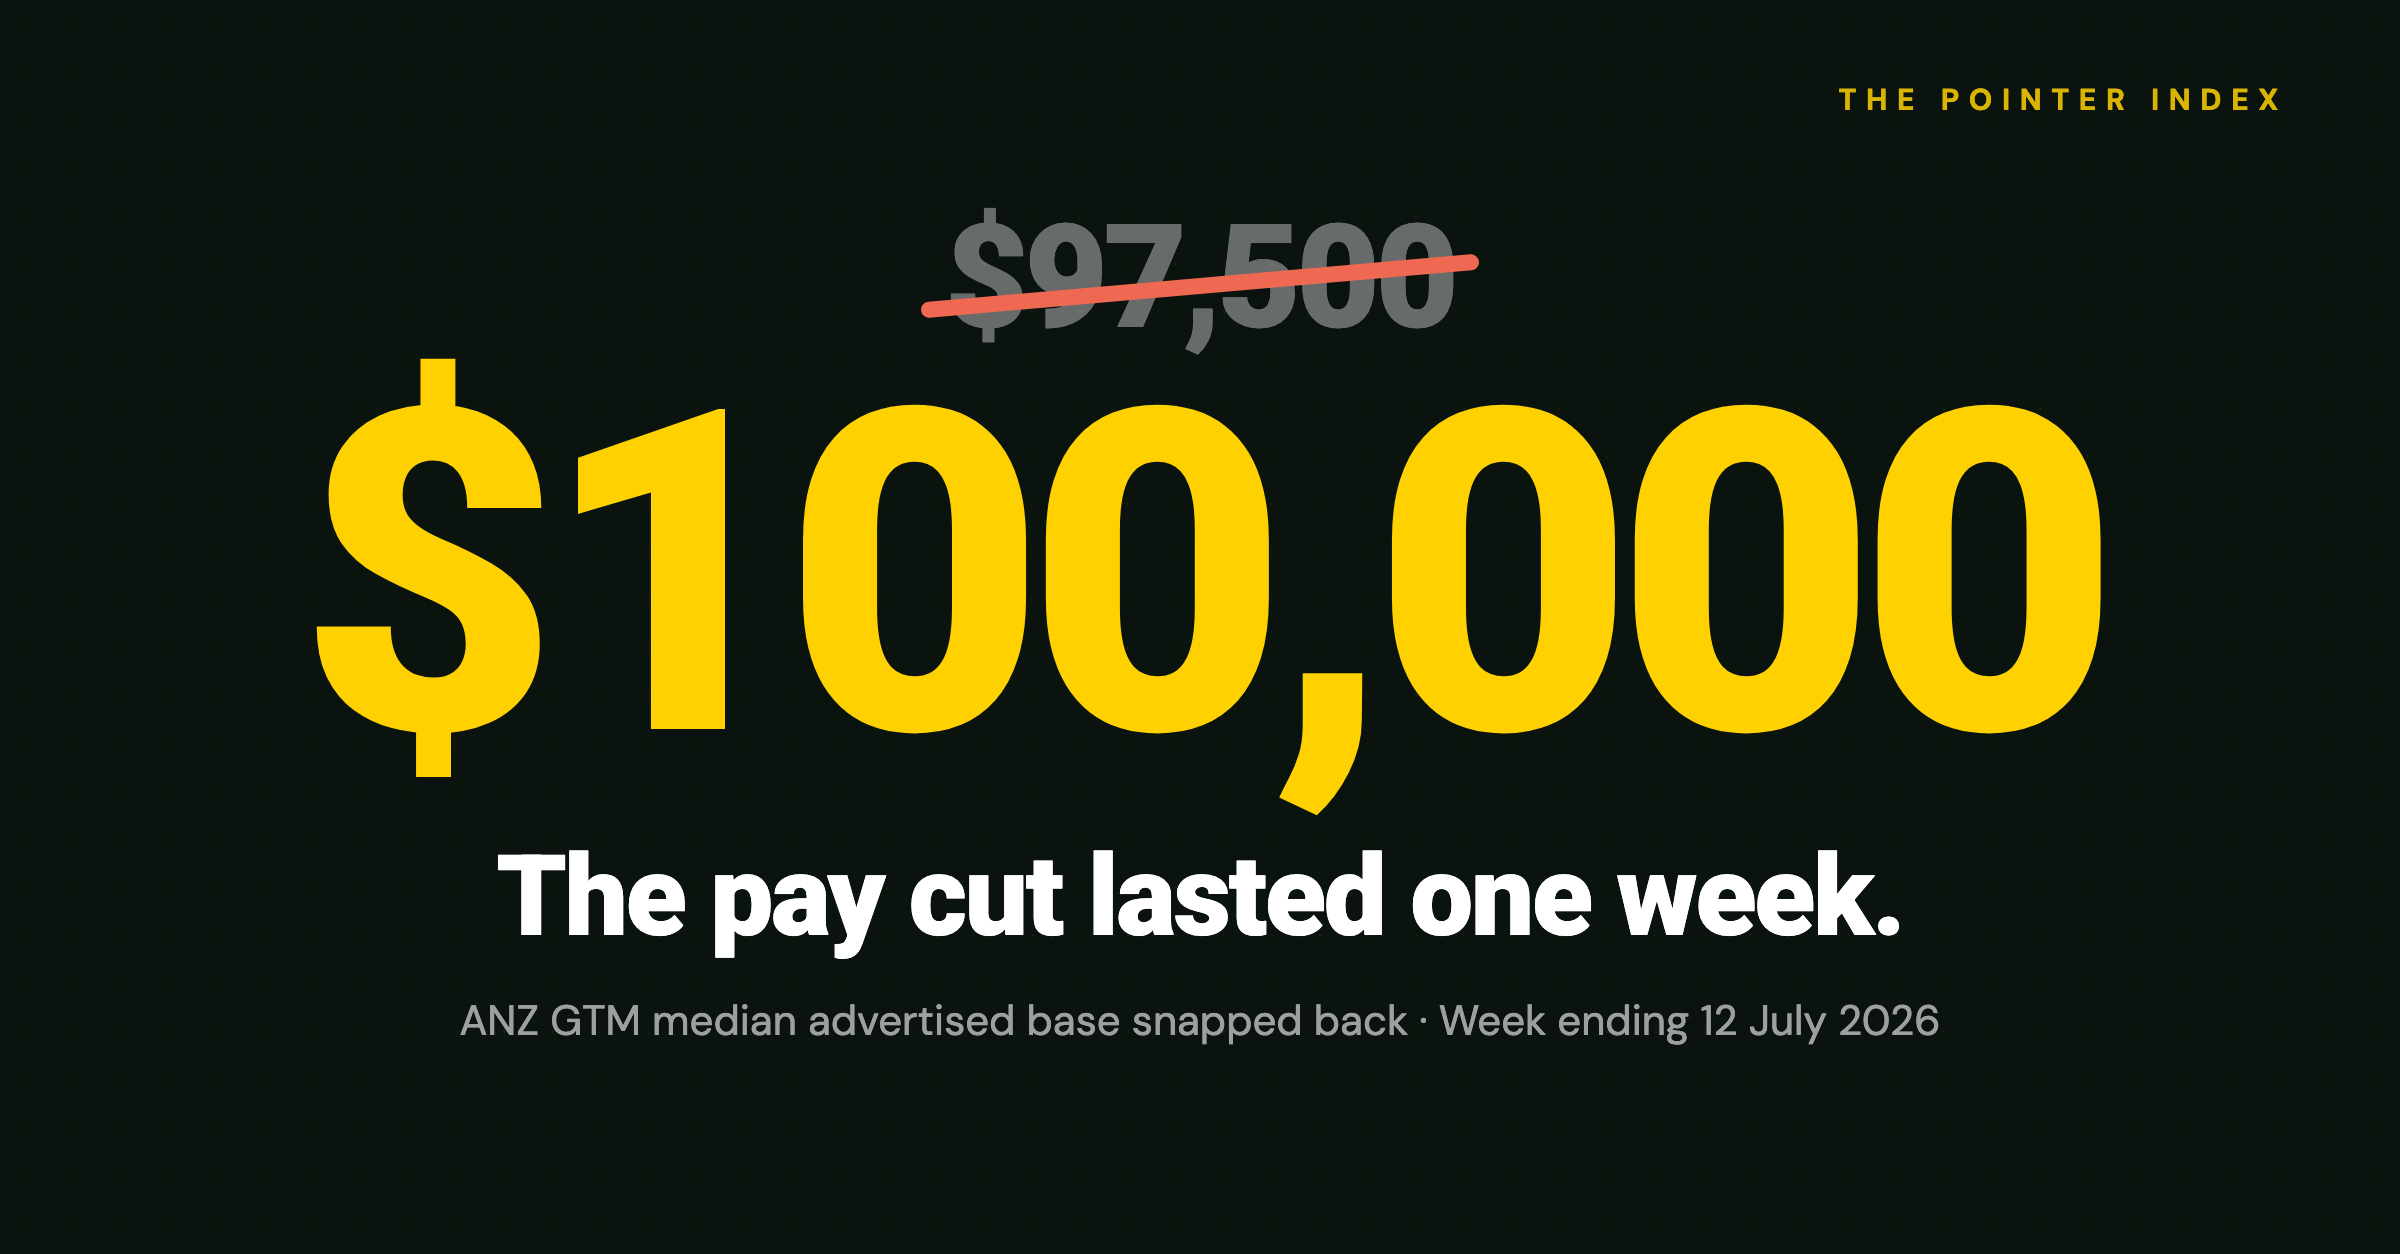
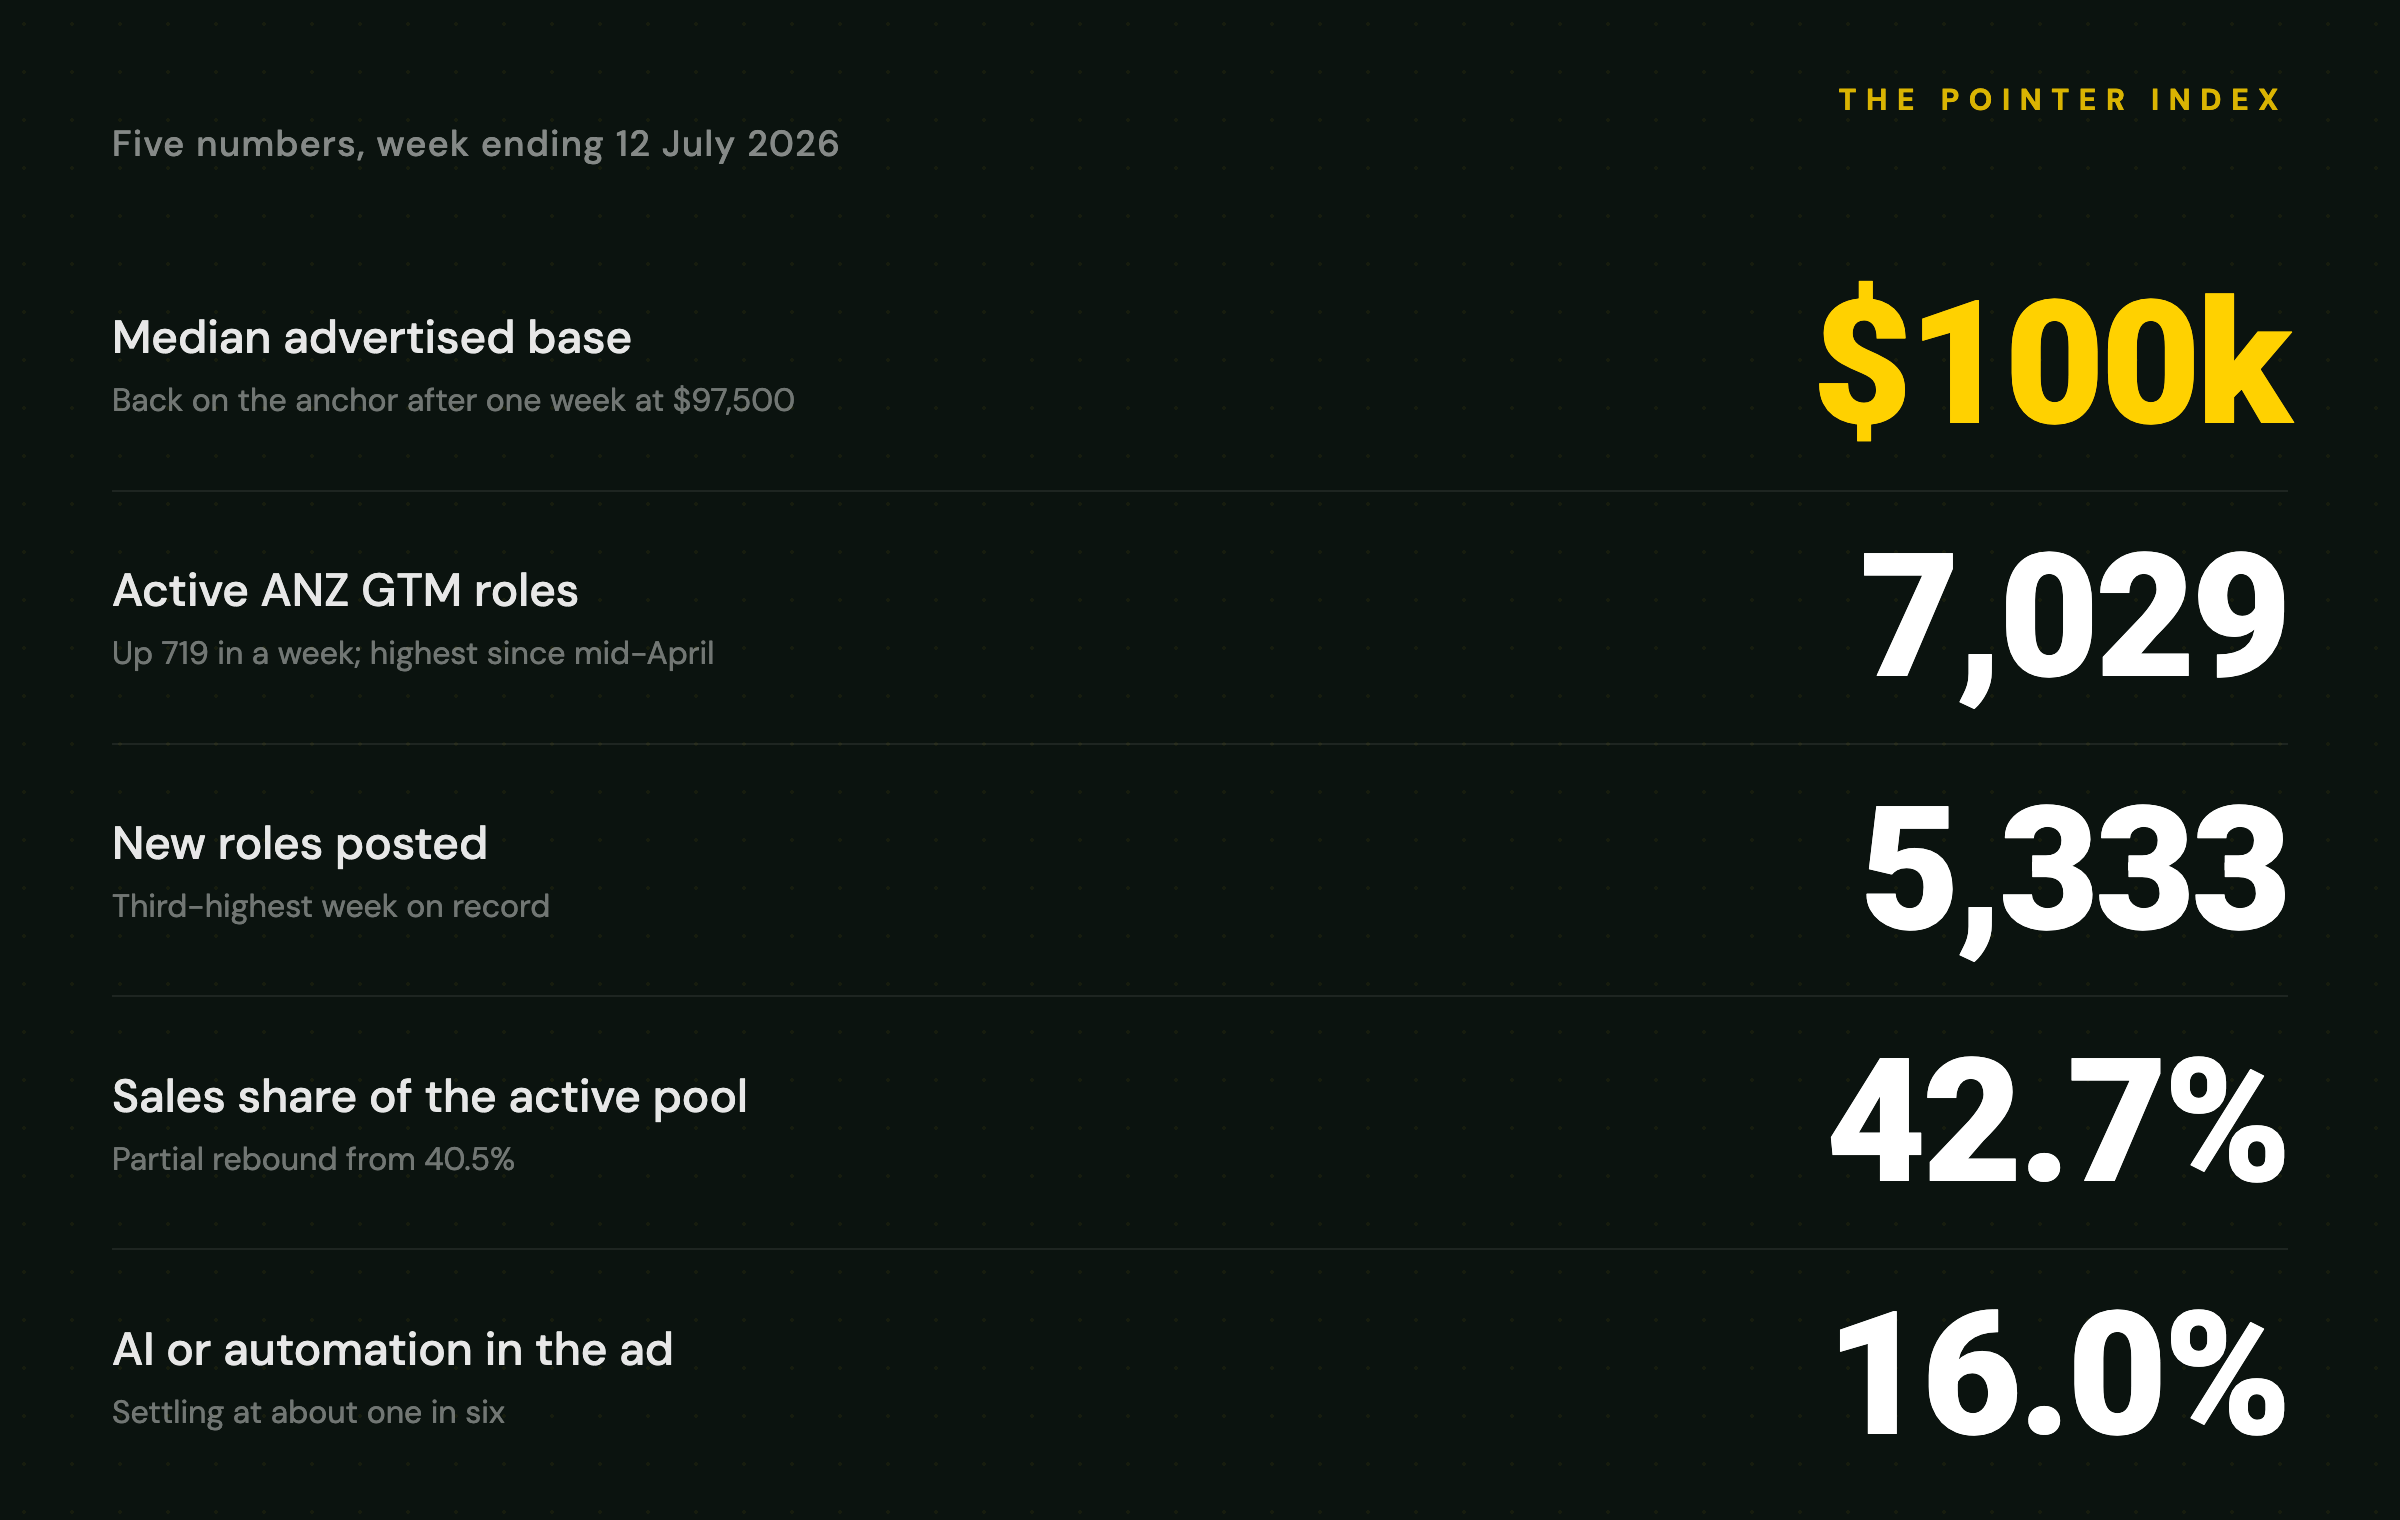
Last week the median advertised base for an ANZ GTM role broke below $100,000 for the first time in thirteen weeks, and we told you the one thing to watch was whether it snapped back. It snapped back. The median printed $100,000 this week, the active pool grew to 7,029 roles, its highest level since mid-April, and the sales roles driving the recovery are advertising more money than before the dip, not less. But the snap-back is not the whole story: underneath the round number, sales repriced up and marketing stayed repriced down.
This is issue 13 of The Pointer Index. Every week, one index, five numbers, one observation. No filler.
The week in five numbers
What the dip actually was
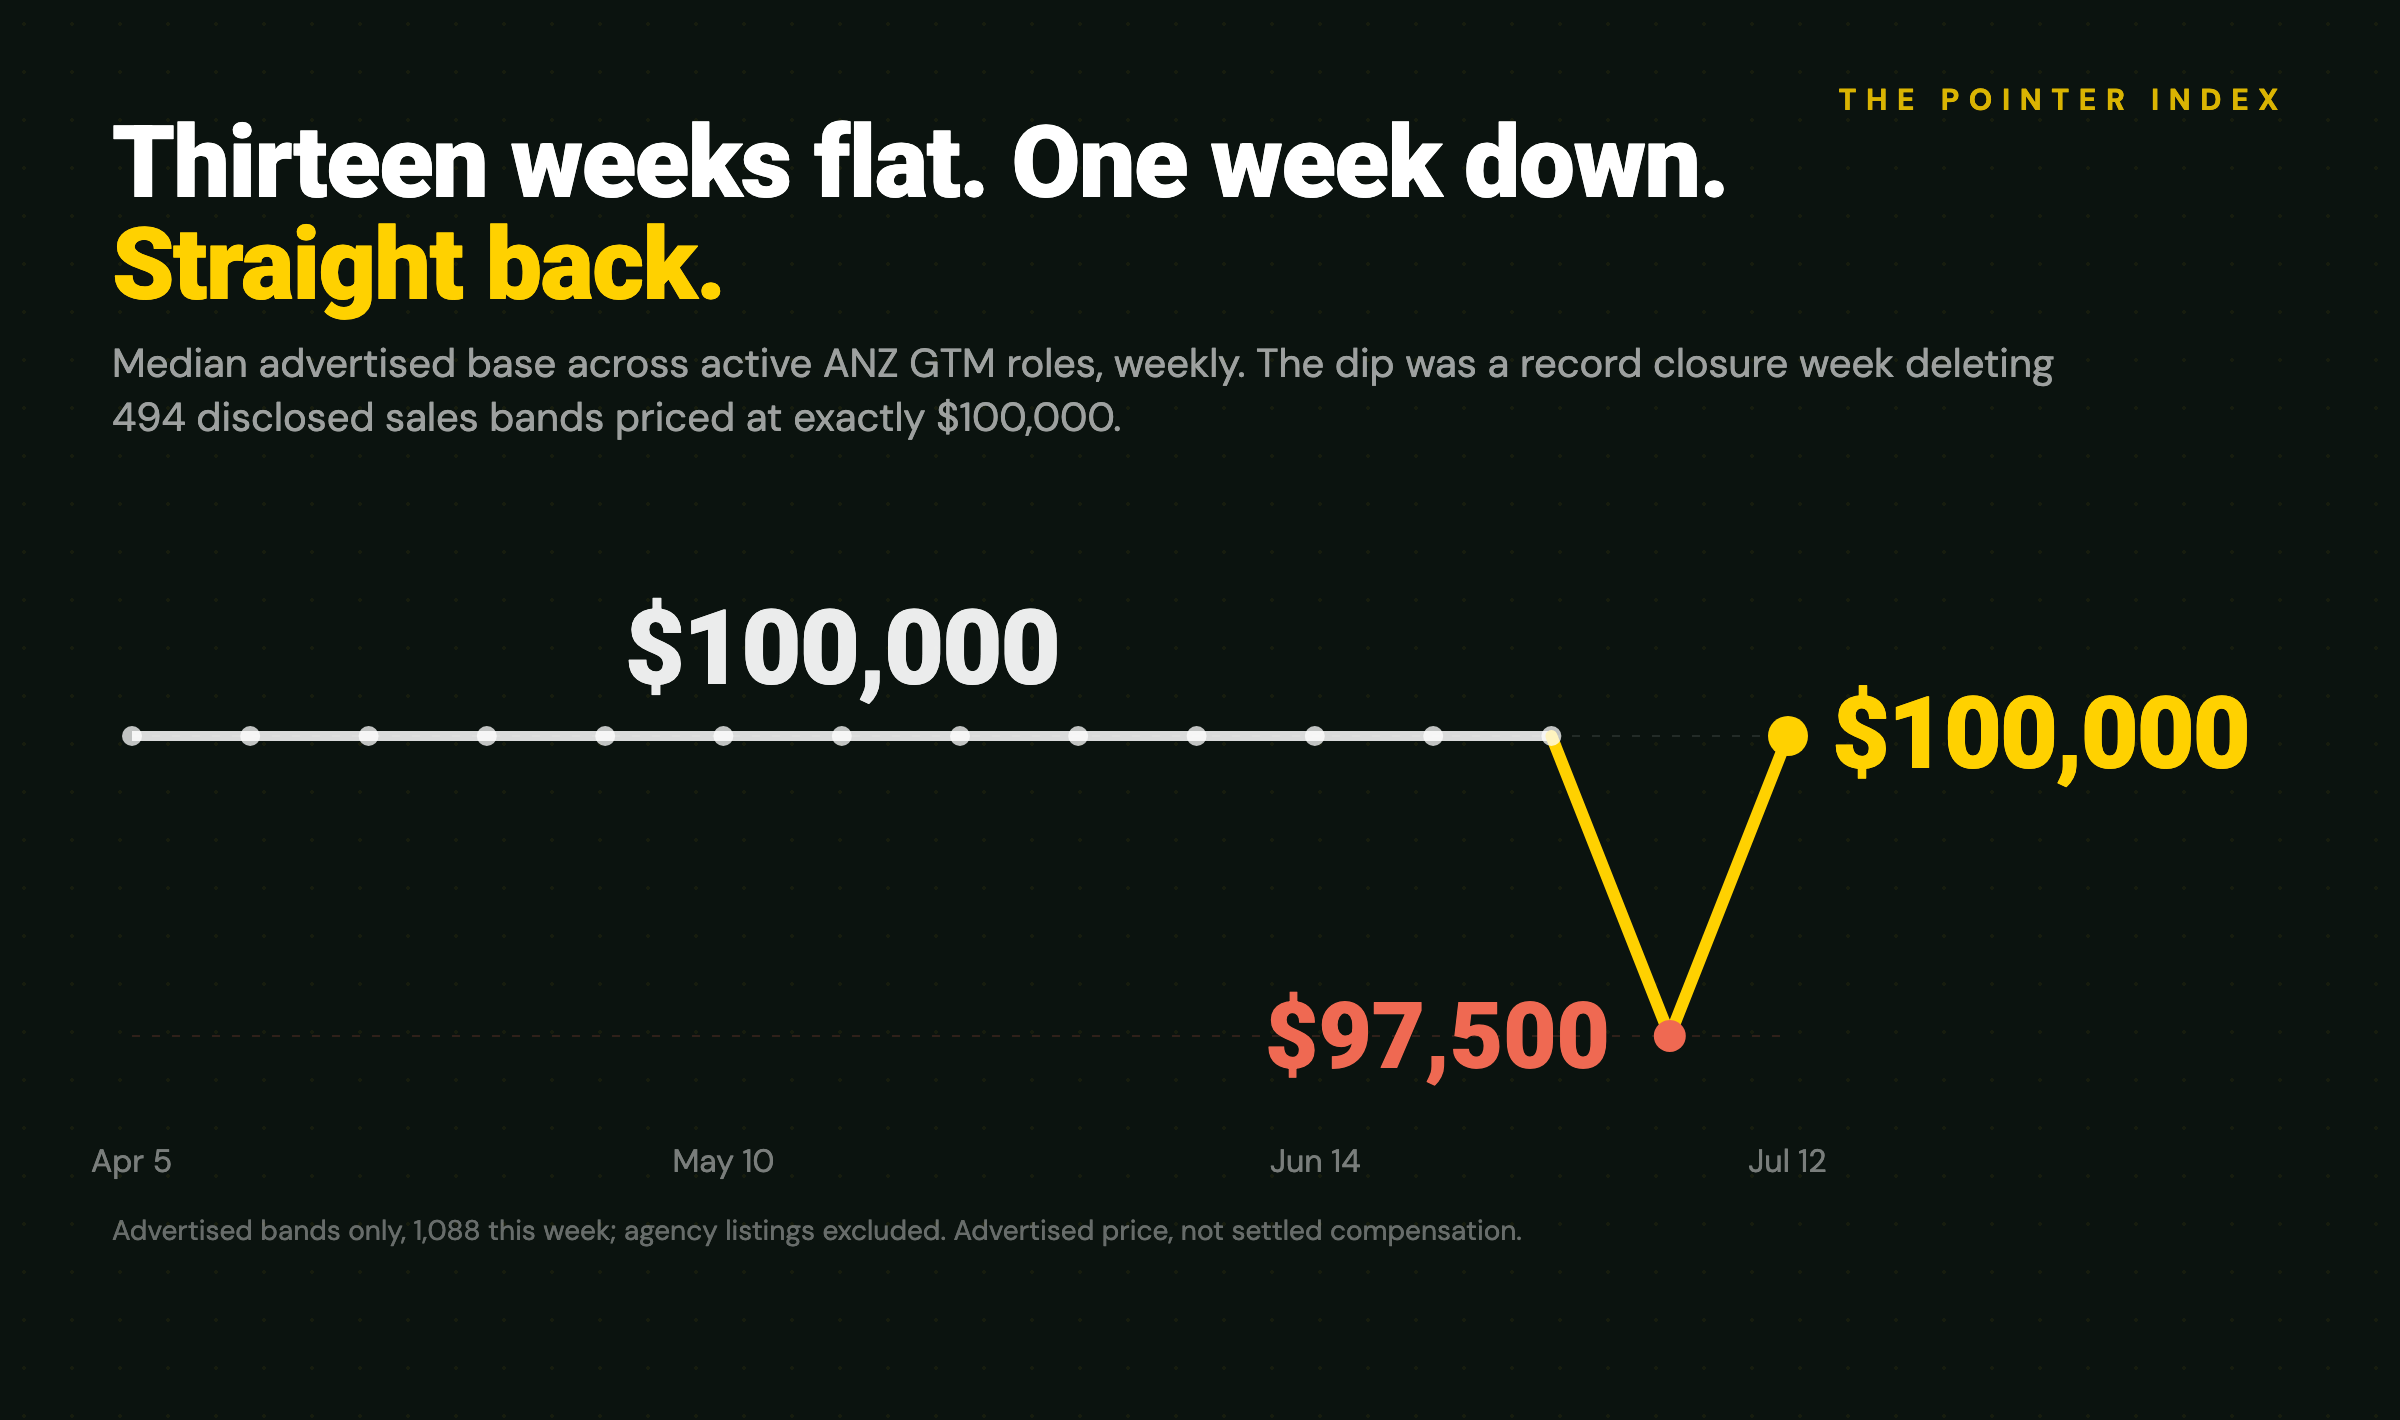
Last week we wrote that the reprice was real, not a mix shift, because the fall showed up inside the functions themselves. This week the data lets us do the full autopsy, and the honest verdict is: partly right, and partly a detection artifact we can now see clearly.
Here is the mechanism. Last week was the biggest closure week on record: 6,726 roles marked closed, and sales took almost all of it, shedding 1,003 roles net in seven days. Inside that closure wave were 494 sales ads with disclosed pay, a cohort priced at a median of exactly $100,000. In one week, the closure engine removed more disclosed sales bands than the 415 that remained. When you delete half the sample and the deleted half sits exactly on the anchor, the median that remains gets decided by the tails, and the tail that week was cheap. That is what printed $97,500.
This week the pool refilled and the artifact unwound. Sales restocked to 3,004 active roles, the disclosed sales sample rebounded to 563 bands, our largest yet, and the fresh cohort did not come back at the old price. It came back above it:
So the sales reprice we flagged last week was not employers marking down the rep. It was a one-week composition event: a record batch of $100k-anchored ads left the pool at once, and the ads arriving now are priced higher than the ones that left. We said one week is not a trend and next week could snap straight back. It did, and in sales it snapped past the anchor.
The split that held
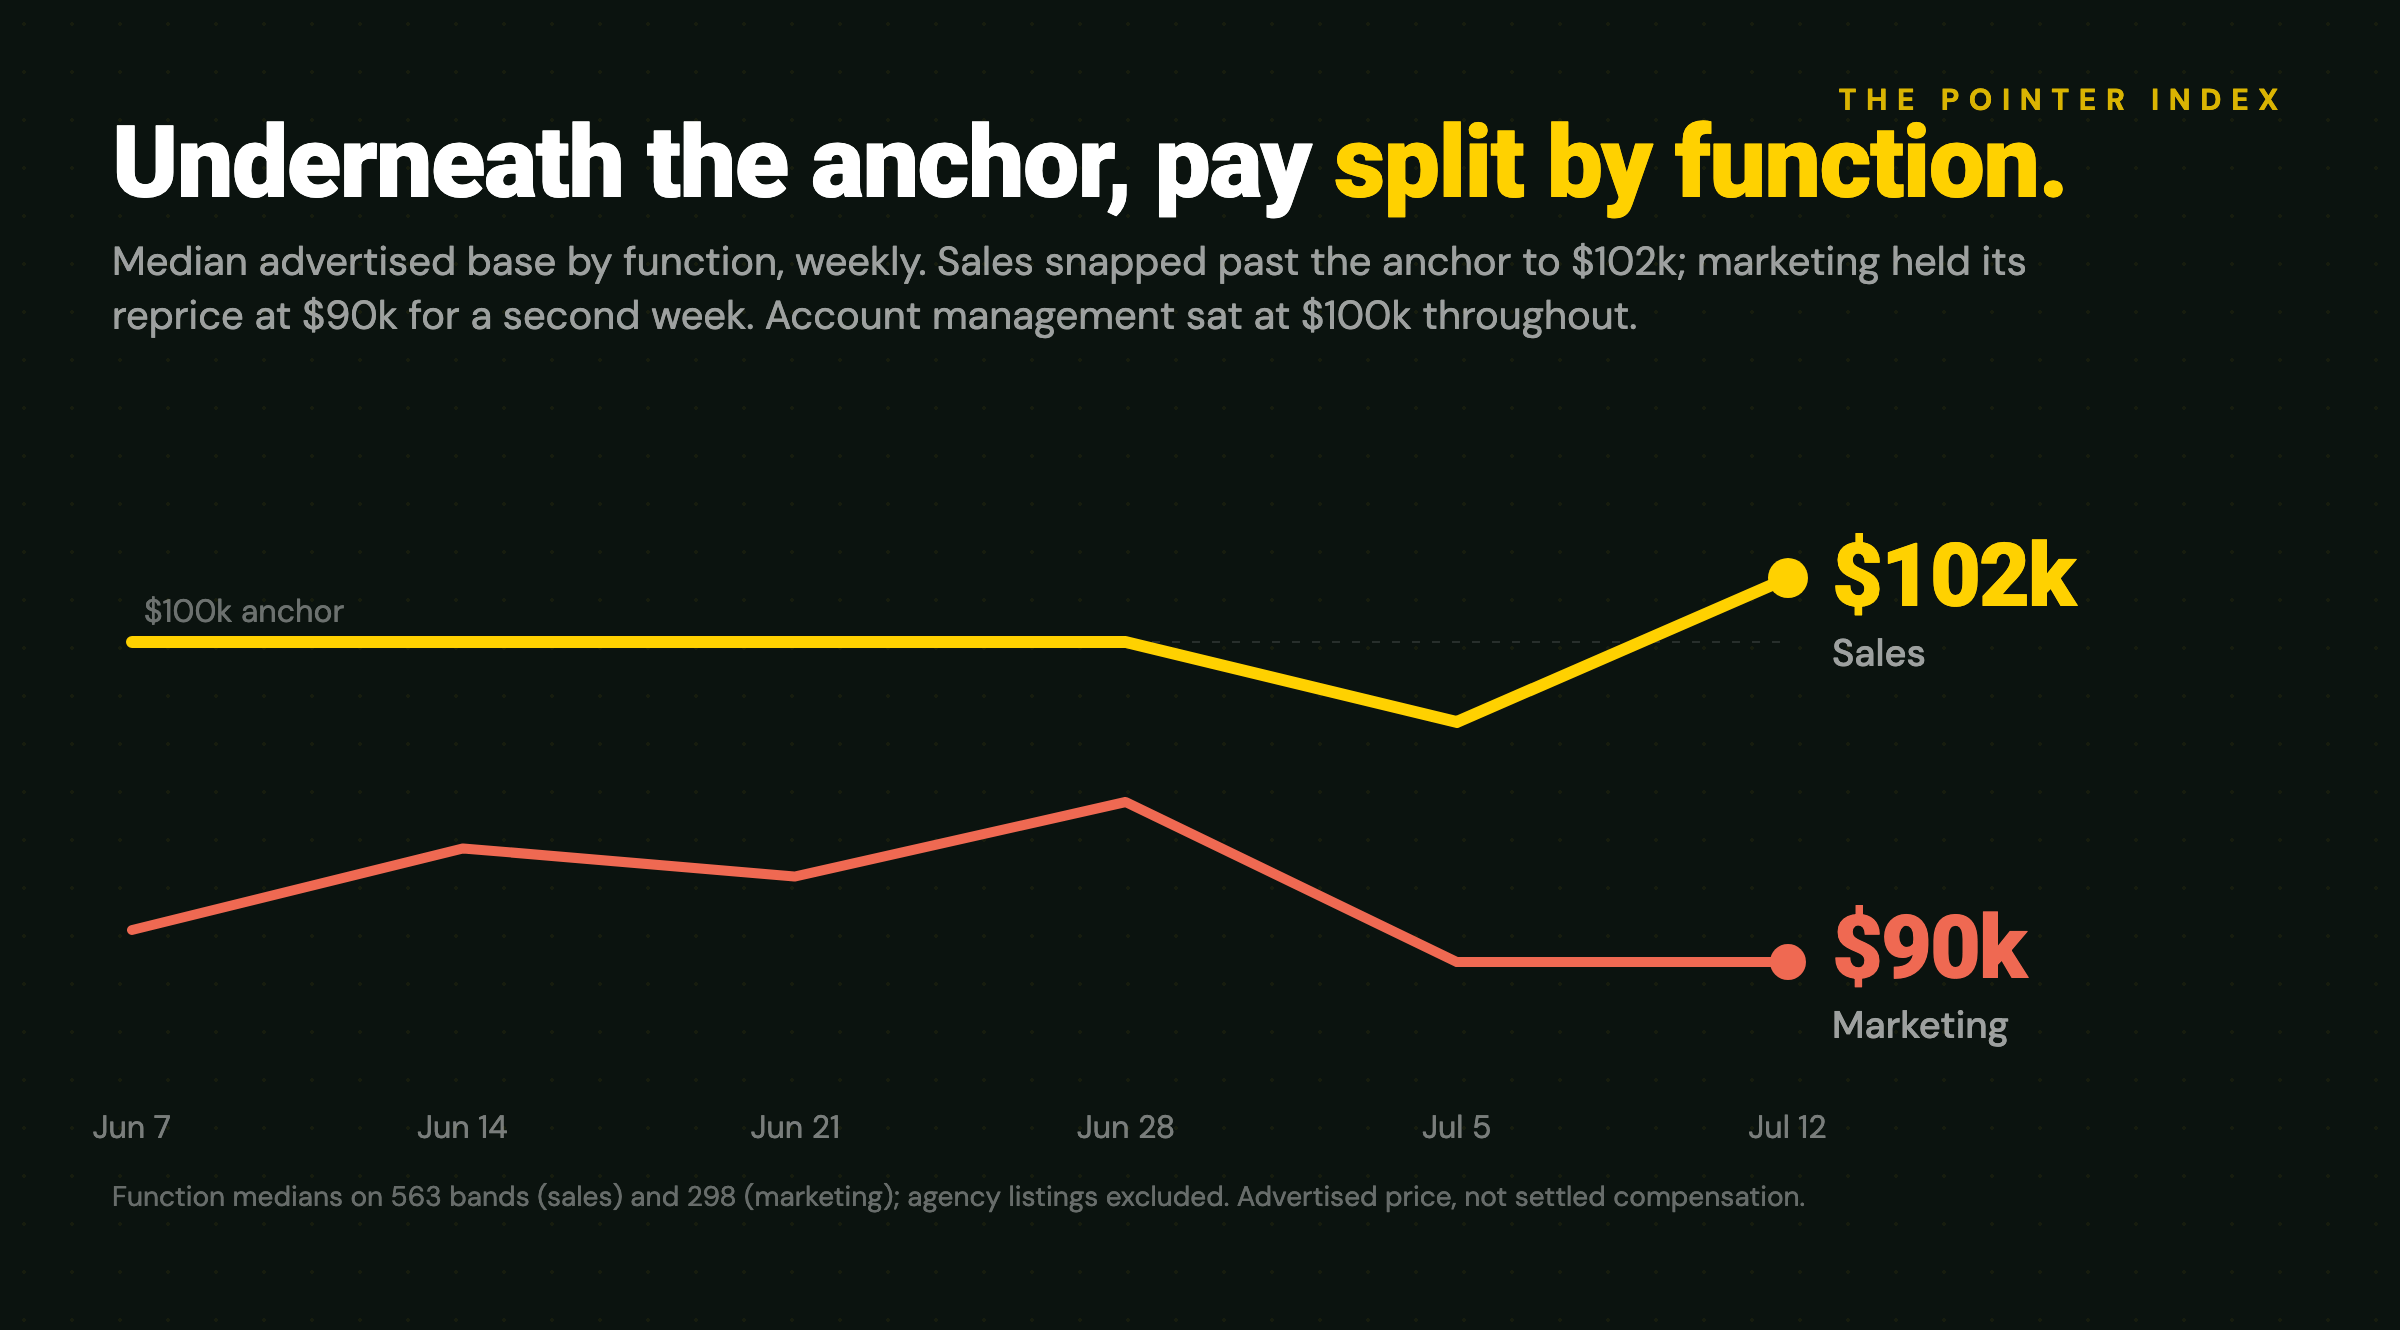
If the whole dip were an artifact, every function would have bounced. One did not.
That is the actual state of ANZ GTM pay in mid-July: the market median snapped back to $100,000 because sales pulled up while marketing stayed down, and the round number at the top of the index is the net of a genuine divergence underneath it. A sales candidate and a marketing candidate reading the same headline live in different markets, about $12,000 apart and moving in opposite directions.
One more structural note while the pool sits at a three-month high: recruitment agencies now hold 9.1% of active ANZ GTM listings, the highest share on record, up from about 6% when this tracker began. Roughly one in eleven GTM ads is now a recruiter posting. Agency listings are excluded from every salary and function figure above, but the trend itself is a signal: bigger pool, record agency share, and near-record posting volume is what a market that expects to keep hiring looks like.
So what
If you are a CRO or revenue leader, last week's advice has a one-week shelf life, and this is the correction. The sales comp headroom we described is gone: the advertised sales median is $102,000, the ceiling recovered to $116,000, and the floor firmed to $95,000, so a sales band set against last week's $97,500 print is now under market. Marketing is the opposite case. The $90,000 median has held for two weeks and the advertised floor slipped to $85,000, so if you are budgeting marketing heads for Q3, the market just handed you a cheaper reference point that looks durable, not noisy. For structuring the sales side of that, see the APAC sales compensation guide.
If you are a hiring manager, the useful lesson is about the index itself: a one-week move in any median, including ours, is a hypothesis, not a fact. The two-week test is the one that matters, and it just separated a real reprice (marketing, $90k twice) from an artifact (sales, straight back up and past). Set bands against the numbers that have printed twice.
If you are a candidate, it depends which market you are in. Sales: the anchor moved back up, advertised ceilings are the highest since April, and the pool of open sales roles grew 17% in a week, so negotiate off $102,000, not the $97,500 headline from last week. Marketing: the reprice held and the floor dropped, so scarcity arguments now work better than anchor arguments; the leverage is in specialisation, not the market line. Account management: nothing moved, $100,000 remains the number. Sanity-check any offer against the OTE calculator before your first call.
One number to watch next week
Marketing median advertised base: $90,000. A third consecutive week at the floor and the marketing reprice is structural, the first durable function-level pay reset since this index began. A bounce back toward $95,000 and the whole June-July pay story closes as noise, with the anchor intact everywhere.
*Built from live ANZ data and updated continuously on the Pointer market data dashboard.*
*The small print. The dip autopsy leans on our closure mechanics, so here they are: we mark a role closed after seven days without reappearing, weekend scraping is thin, and trailing closures bunch into single detection windows. Last week's record 6,726 closures were multi-week trailing closures detected at once, which is exactly why 494 disclosed sales bands left the pool in a single week and why we now read last week's sales print as a composition event rather than a reprice. The 494-band closed cohort and its $100,000 median were measured directly from the closed listings. Per-function salary samples have been recorded since early June, so "largest sample yet" claims refer to that window. This week's flow numbers read 5,333 opened, 5,500 closed, net -167; treat weekly closures as a smoothed multi-week trend, not a clean seven-day delta. We do not report days-on-market: our measure captures days advertised, not time to fill.*
*Methodology. "GTM" means Sales, Account Management, Marketing, CS, Presales, RevOps, Enablement, Partnerships, Growth, PMM, and GTM Engineering. Numbers come from live ANZ job listings scraped from public records; recruitment agency listings are excluded from function breakdowns and salary figures, and their 9.1% share is reported separately above. Salary numbers derive from advertised bands only, 1,088 disclosed bands this week across 7,029 active roles, or 15.8% transparency; they measure advertised price, not settled compensation. Function medians cited rest on 563 bands (sales), 298 (marketing), and 93 (account management); we do not publish a median from fewer than 30 bands. The AI or automation share is the percentage of active listings whose description contains the whole words ai, llm, gpt, generative, or automation; it measures the language of the ad, not the content of the role. All figures are a point-in-time snapshot at the close of the reporting week, Sunday 12 July 2026, recorded in an insert-only weekly index that is never recomputed; the live dashboard updates continuously and may differ slightly. The tracker turned on in the week ending 5 April 2026, so references to highs and lows refer to the weeks on hand. If a number looks wrong, reply to the newsletter or contact us. Corrections run in the next issue.*