

Issue 14 of The Pointer Index · Week ending 19 July 2026
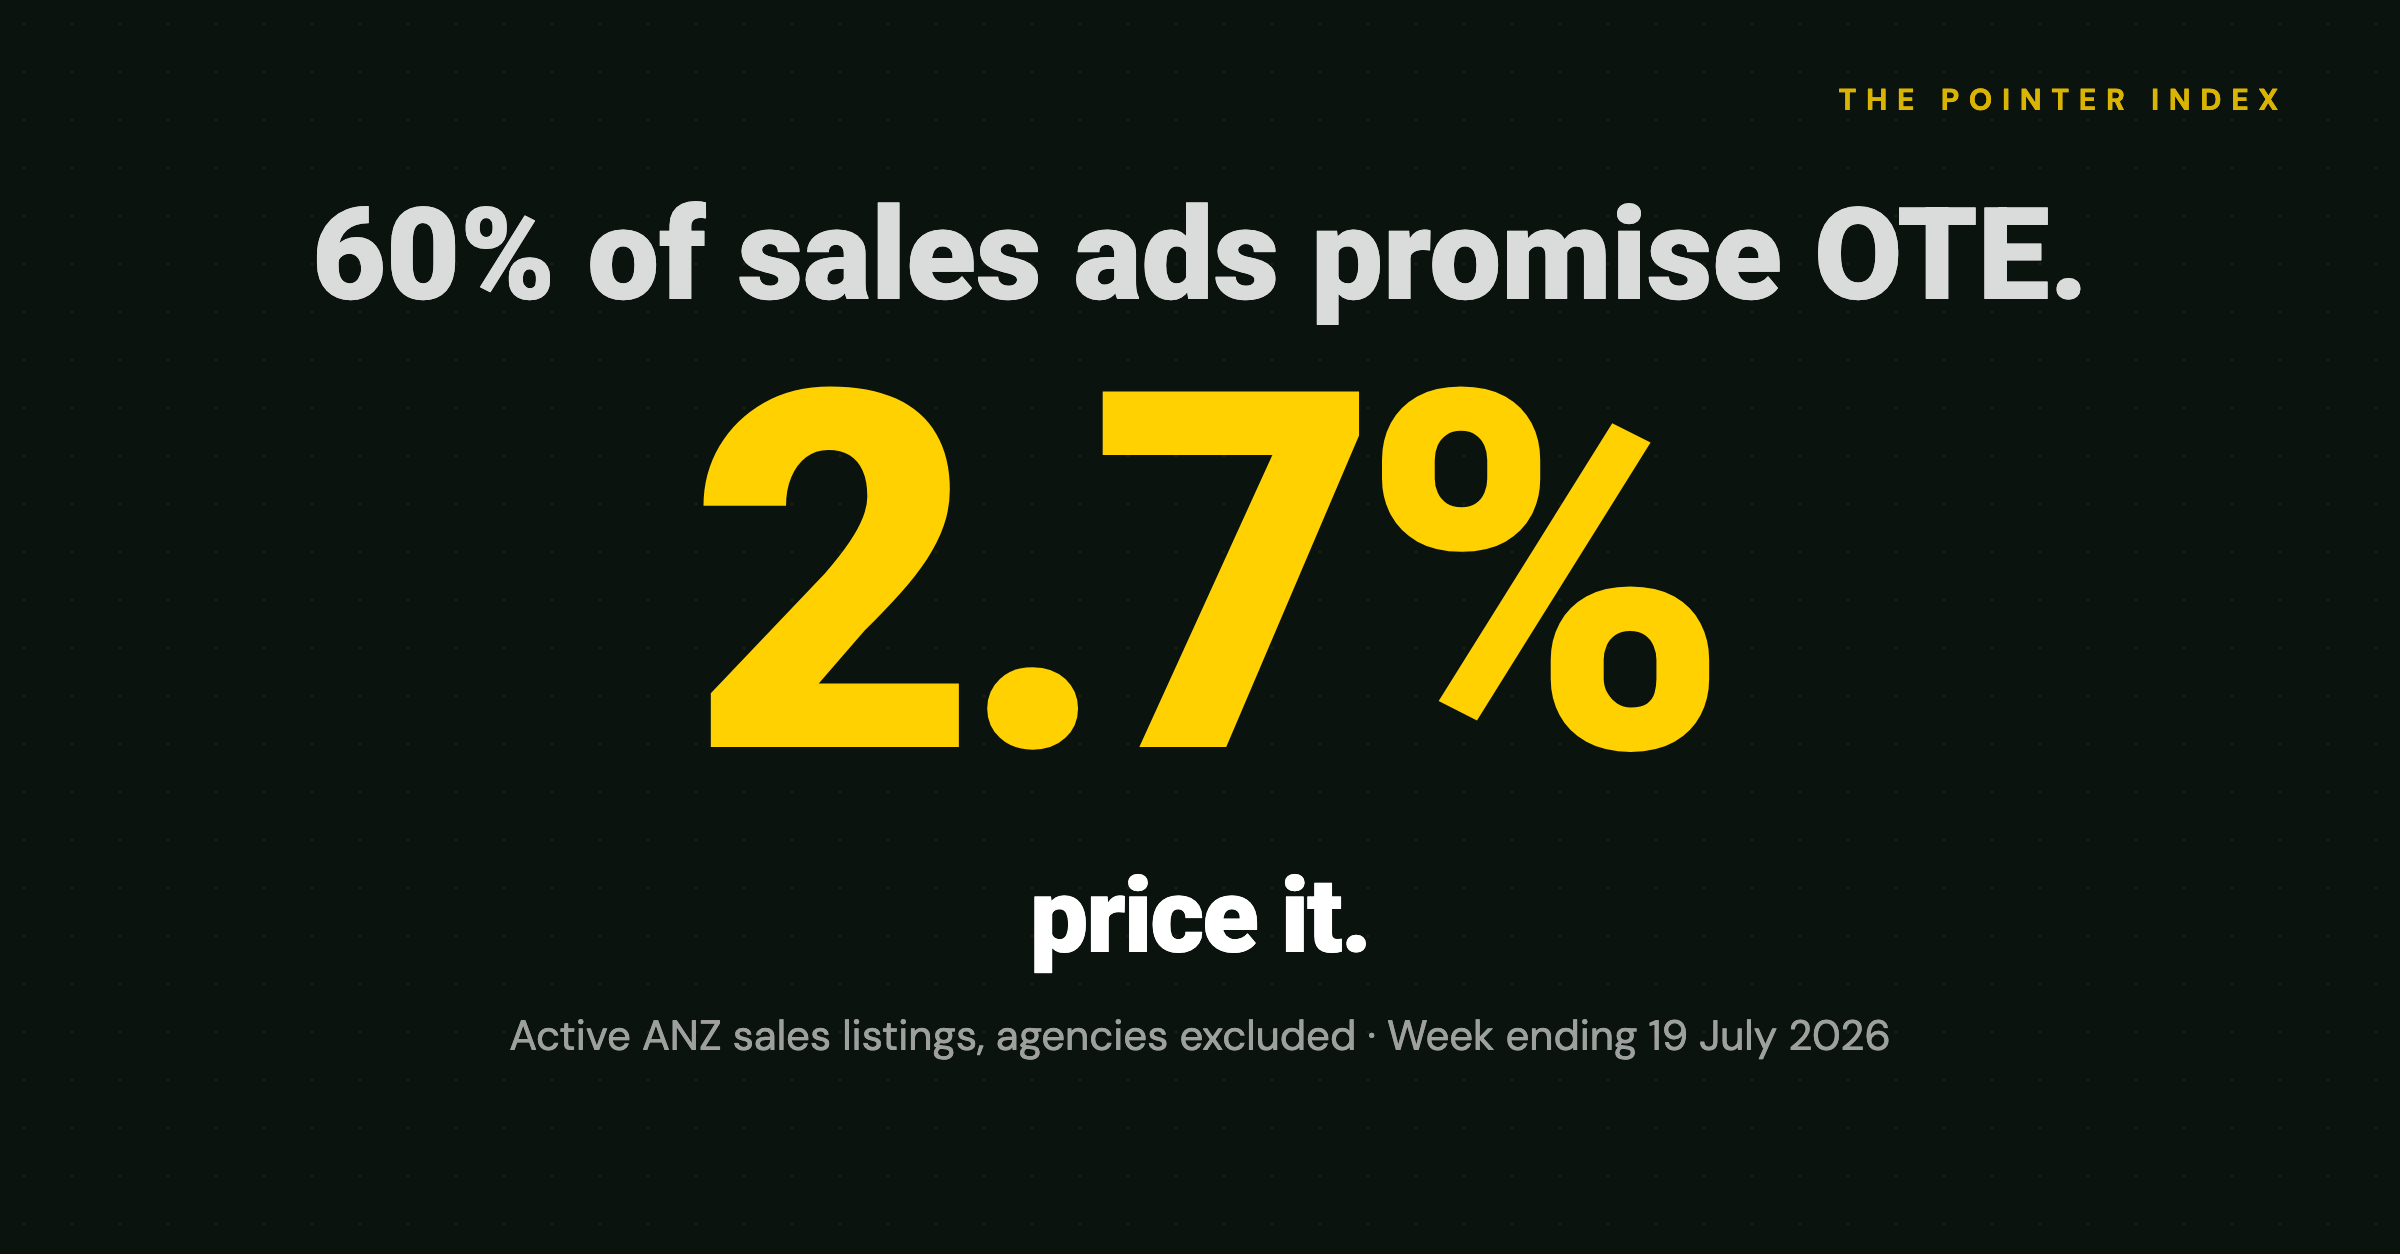
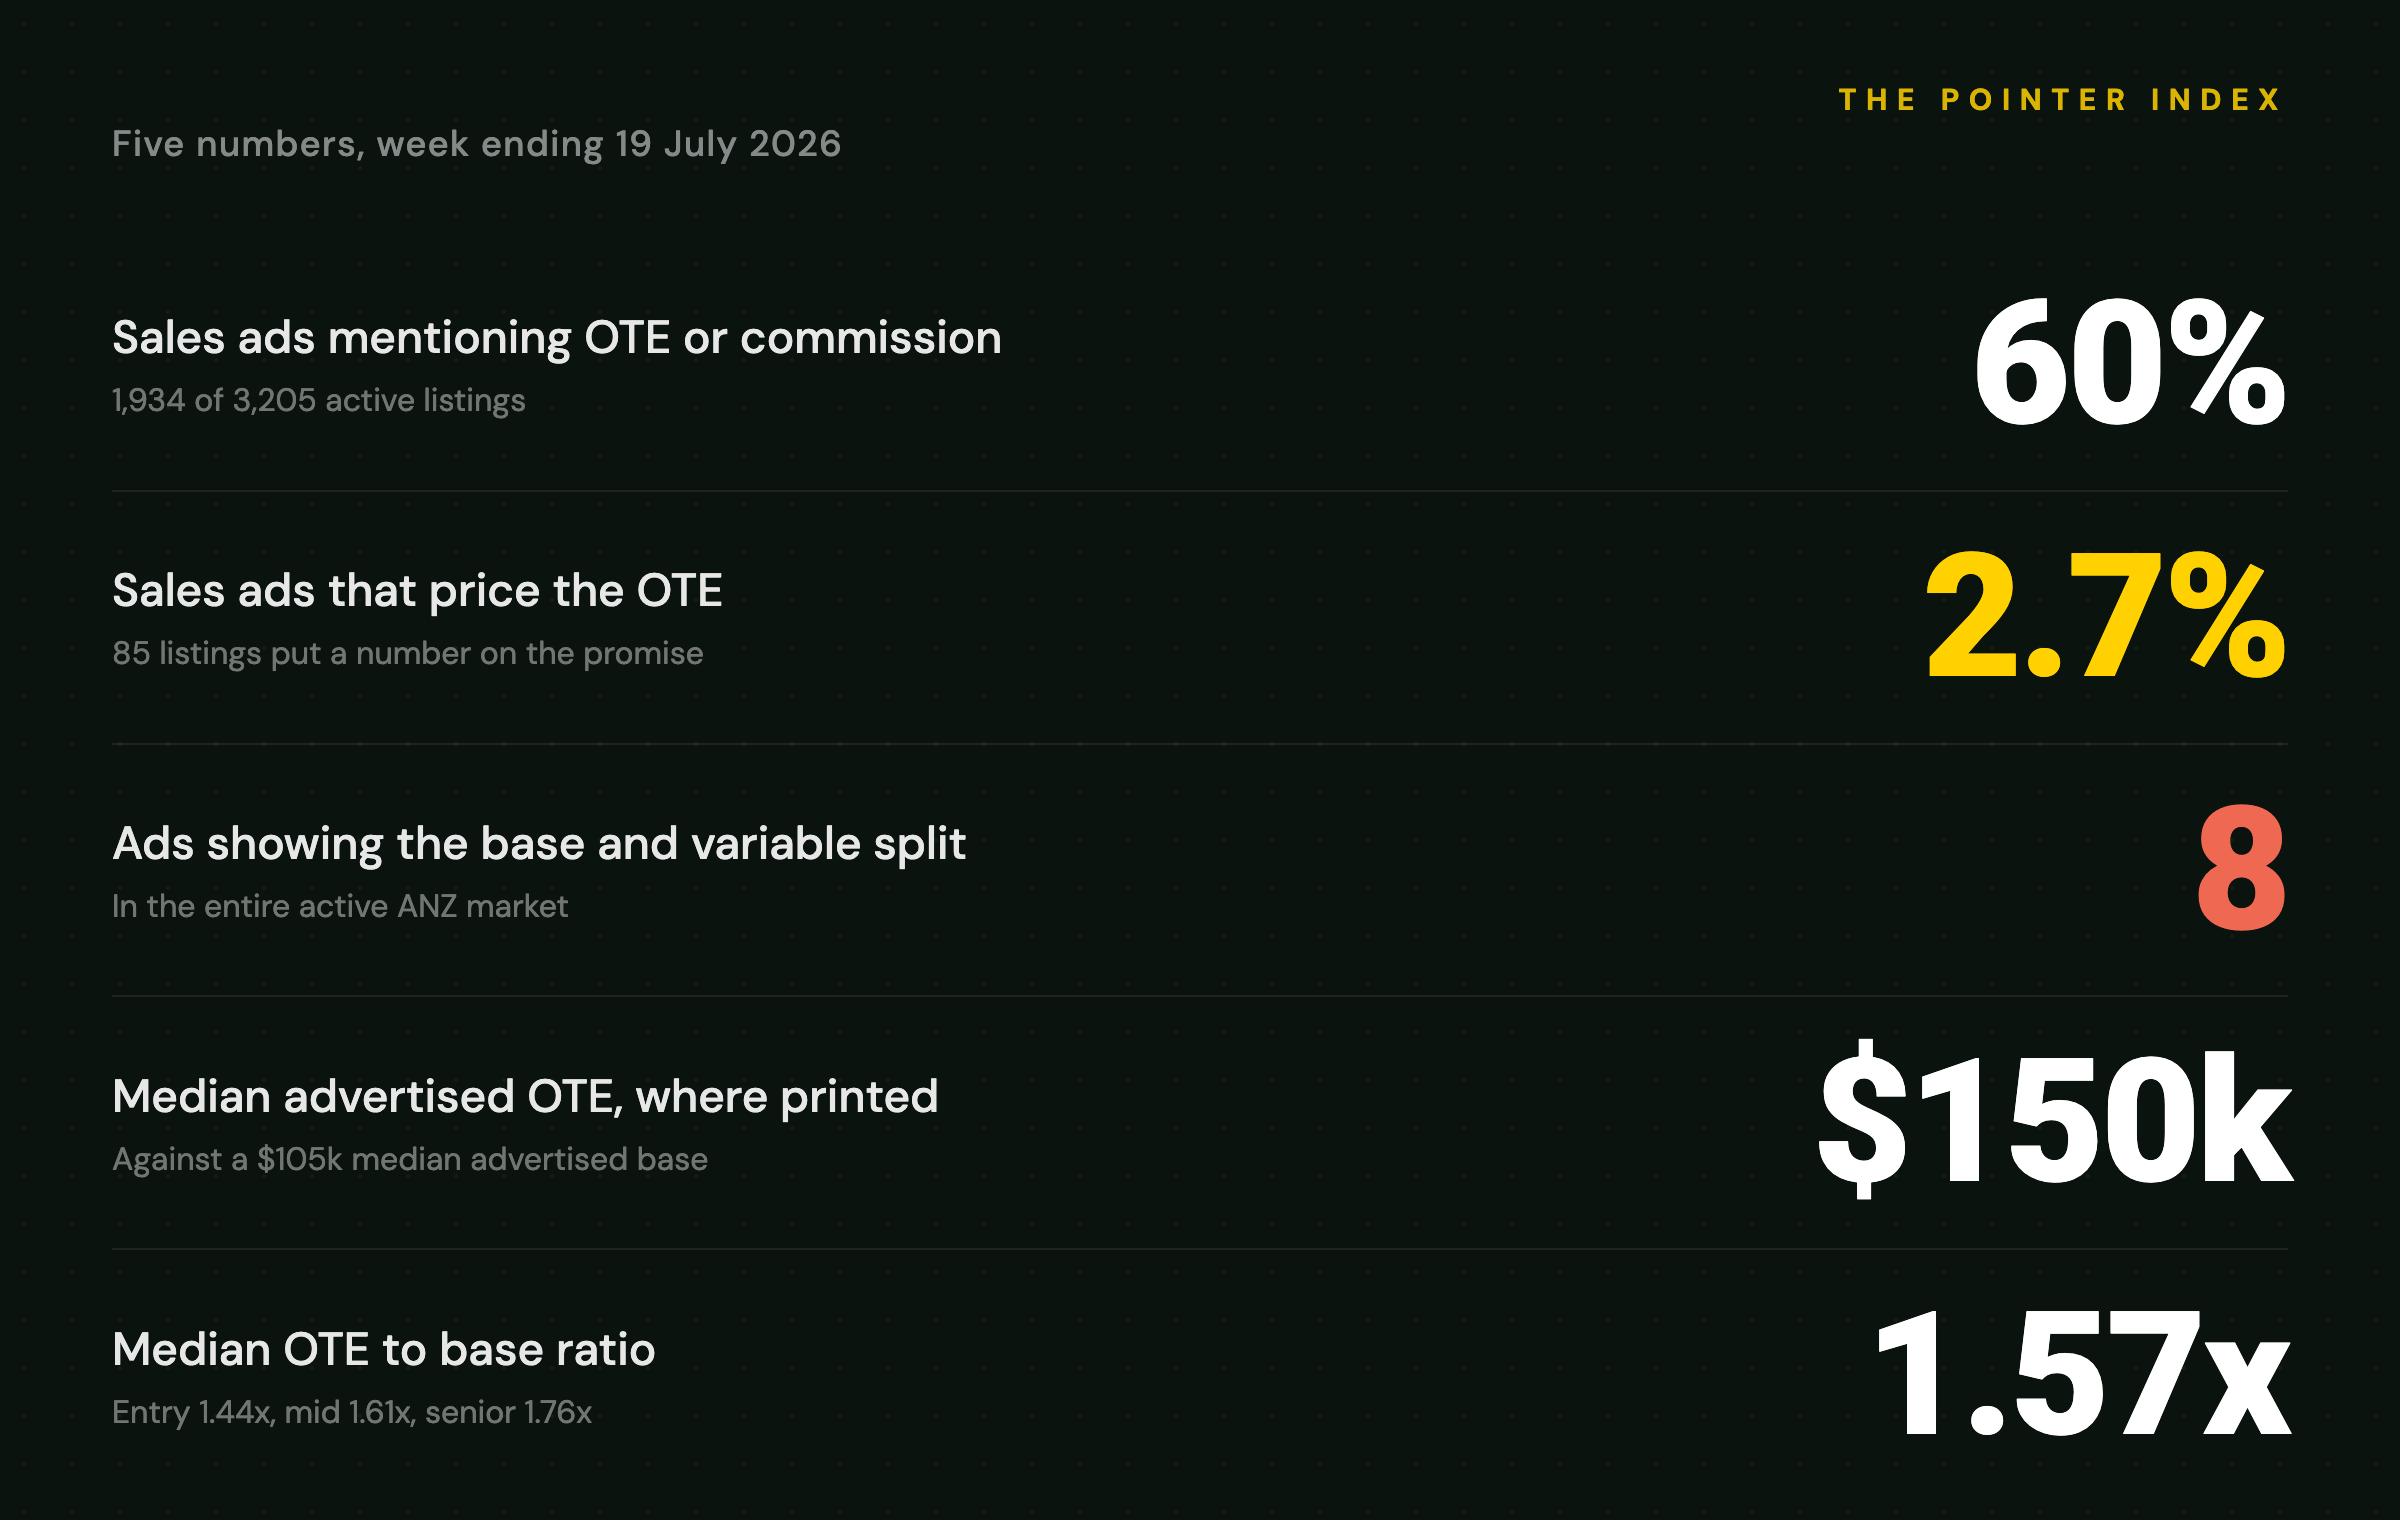
Sixteen weeks into this index, the base median has taught us its one lesson: it barely moves, because salaries do not reprice weekly. Last issue was a case study in exactly that. So this week we pointed the machinery at the number that actually decides whether a seller takes your offer, and found that the market has agreed, almost unanimously, not to write it down. Seventeen percent of active sales ads mention OTE, commission or uncapped earnings at all. Fewer than three percent put a number on it. Eight ads in the entire ANZ market show the base and variable split.
This is issue 14 of The Pointer Index. Every week, one index, five numbers, one observation. No filler.
The numbers
Vague on purpose
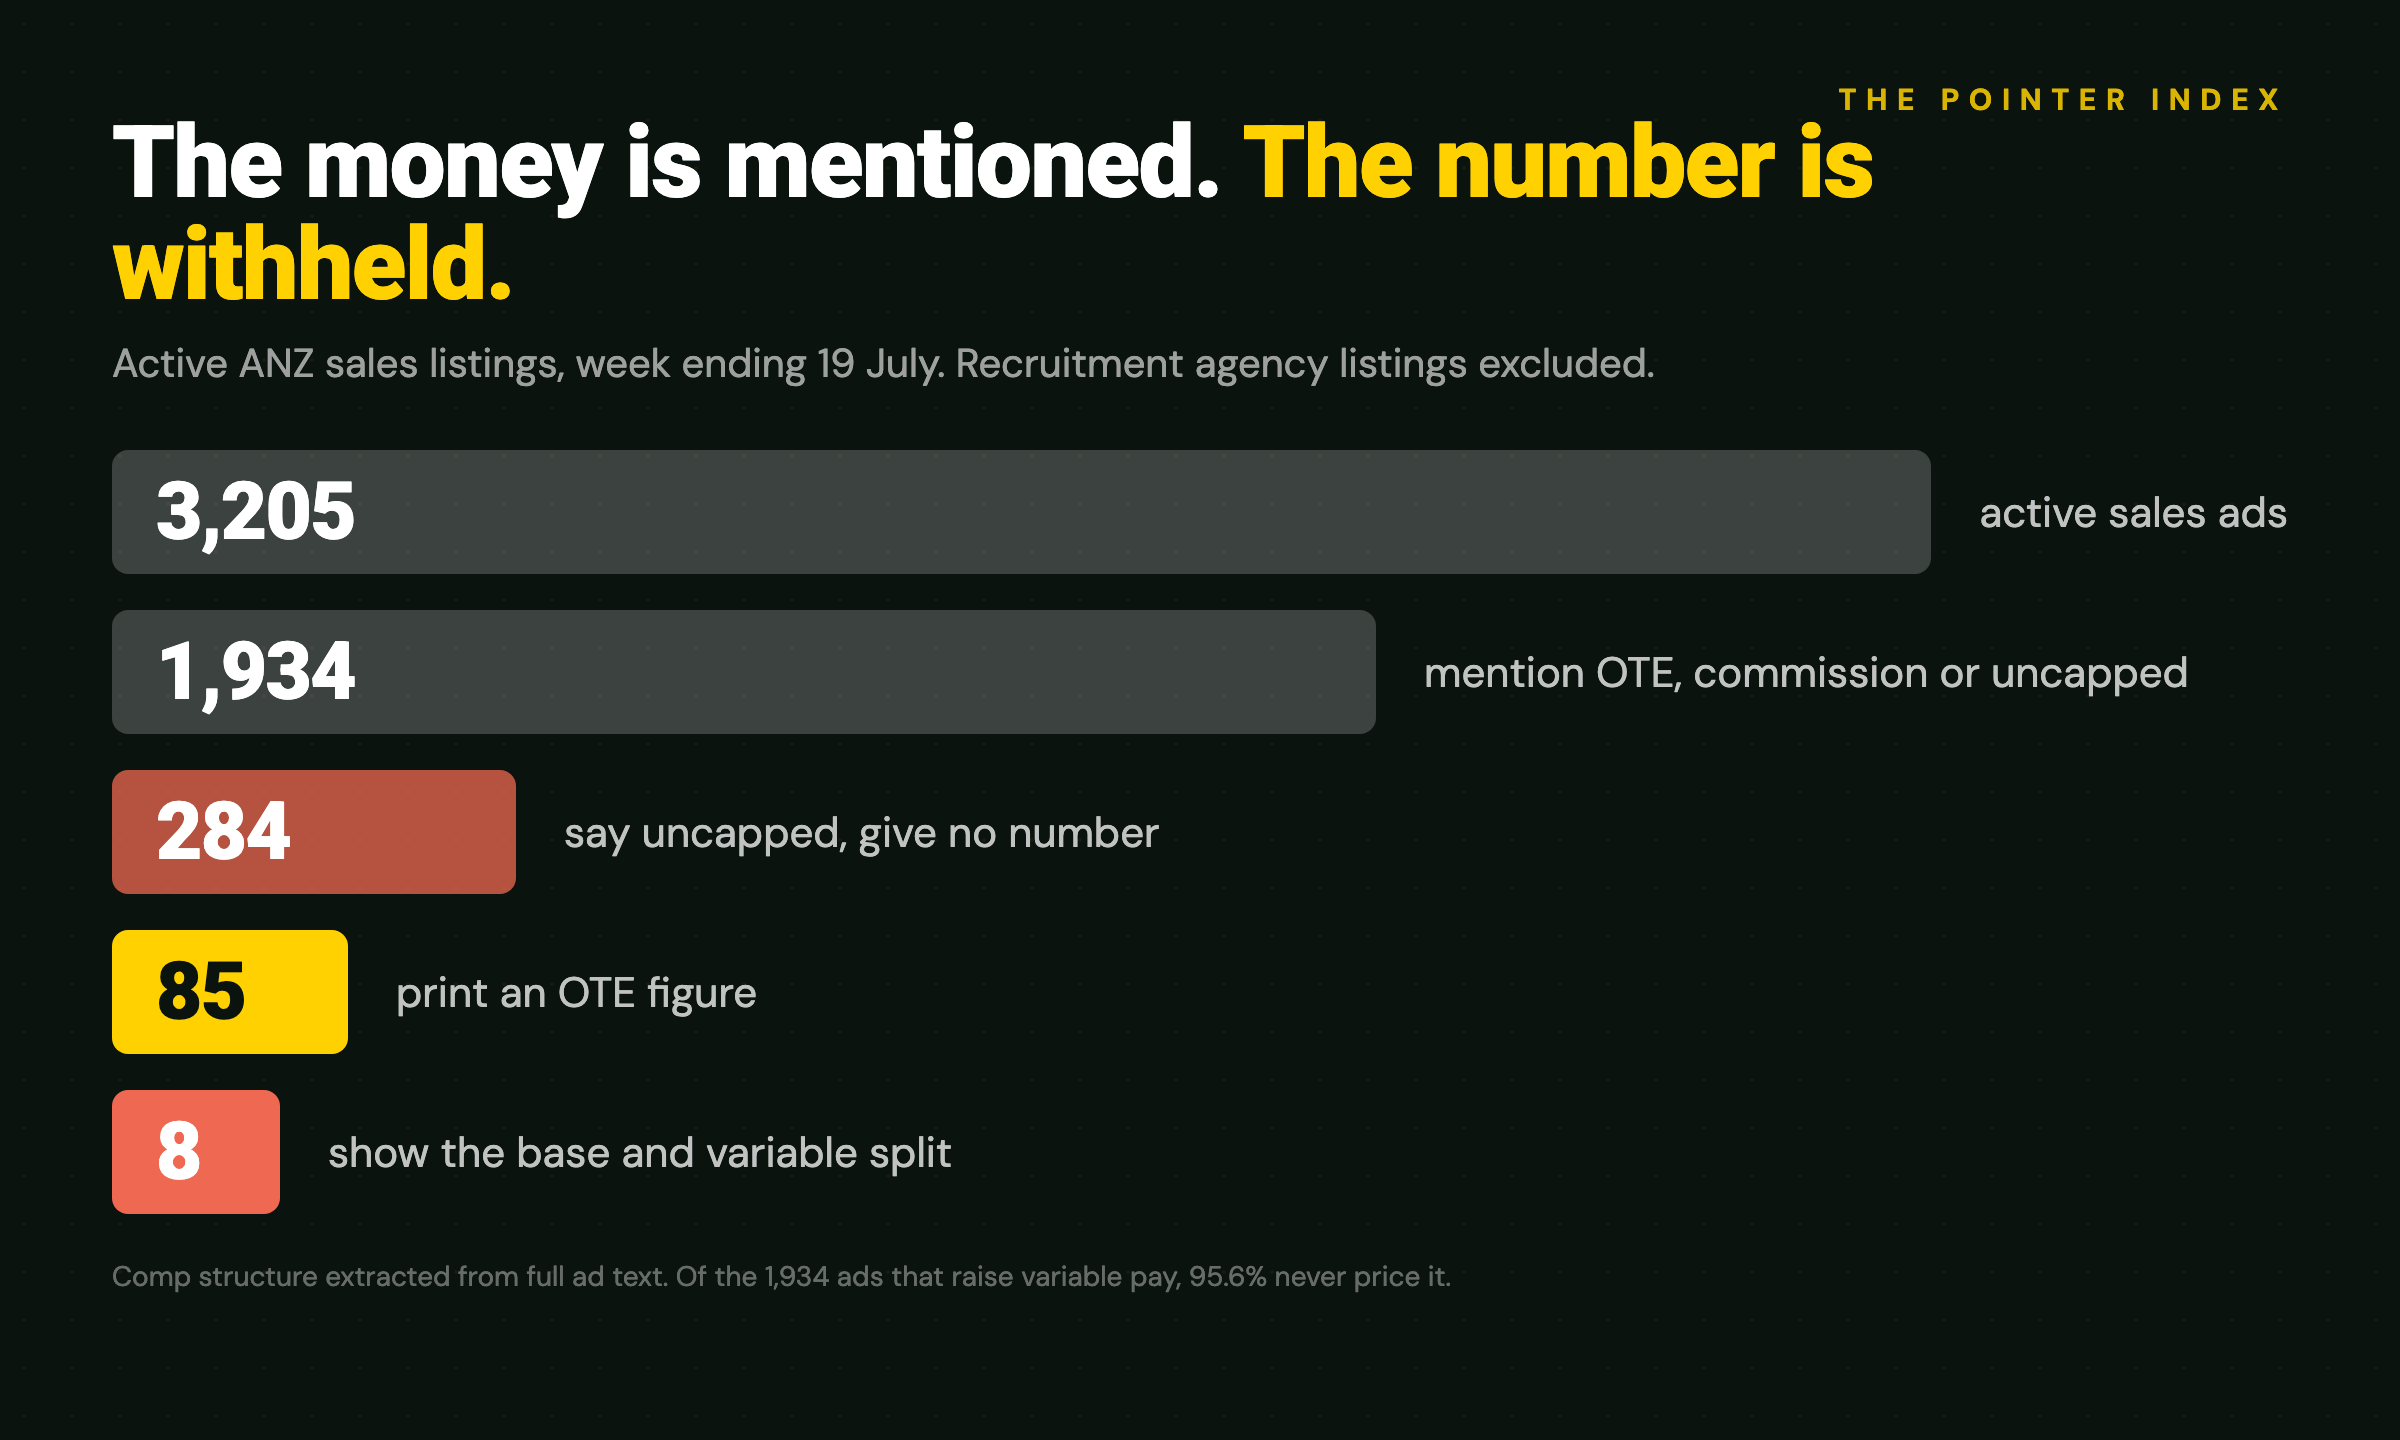
The gap between mentioning money and naming it is too wide to be an accident. An employer who writes "generous commission structure" or "uncapped earning potential" has thought about the plan; they have a spreadsheet somewhere with the split, the quota and the accelerators. They chose not to publish it.
The choice is rational. An unpriced OTE keeps three options open. It lets the employer price the candidate instead of the role, seeing who comes forward before locking anything in. It avoids anchoring a strong applicant who might have said yes to less. And it never leaves a written number that this year's team can compare against, or that next year's ad has to beat. The 284 ads that say "uncapped" and stop there are the purest form of it: a claim about the ceiling that commits to nothing, and it outnumbers actual OTE figures three to one.
The cost of the choice sits with the seller reading the ad. A sales candidate scanning this market sees a base, a promise, and no way to compare one promise against another. Which is why the 85 ads that do print the number are worth studying: where an OTE appears, the median is $150,000, half again the market's median base. The information exists. It is just scarce.
The ladder: the higher the title, the bigger the bet
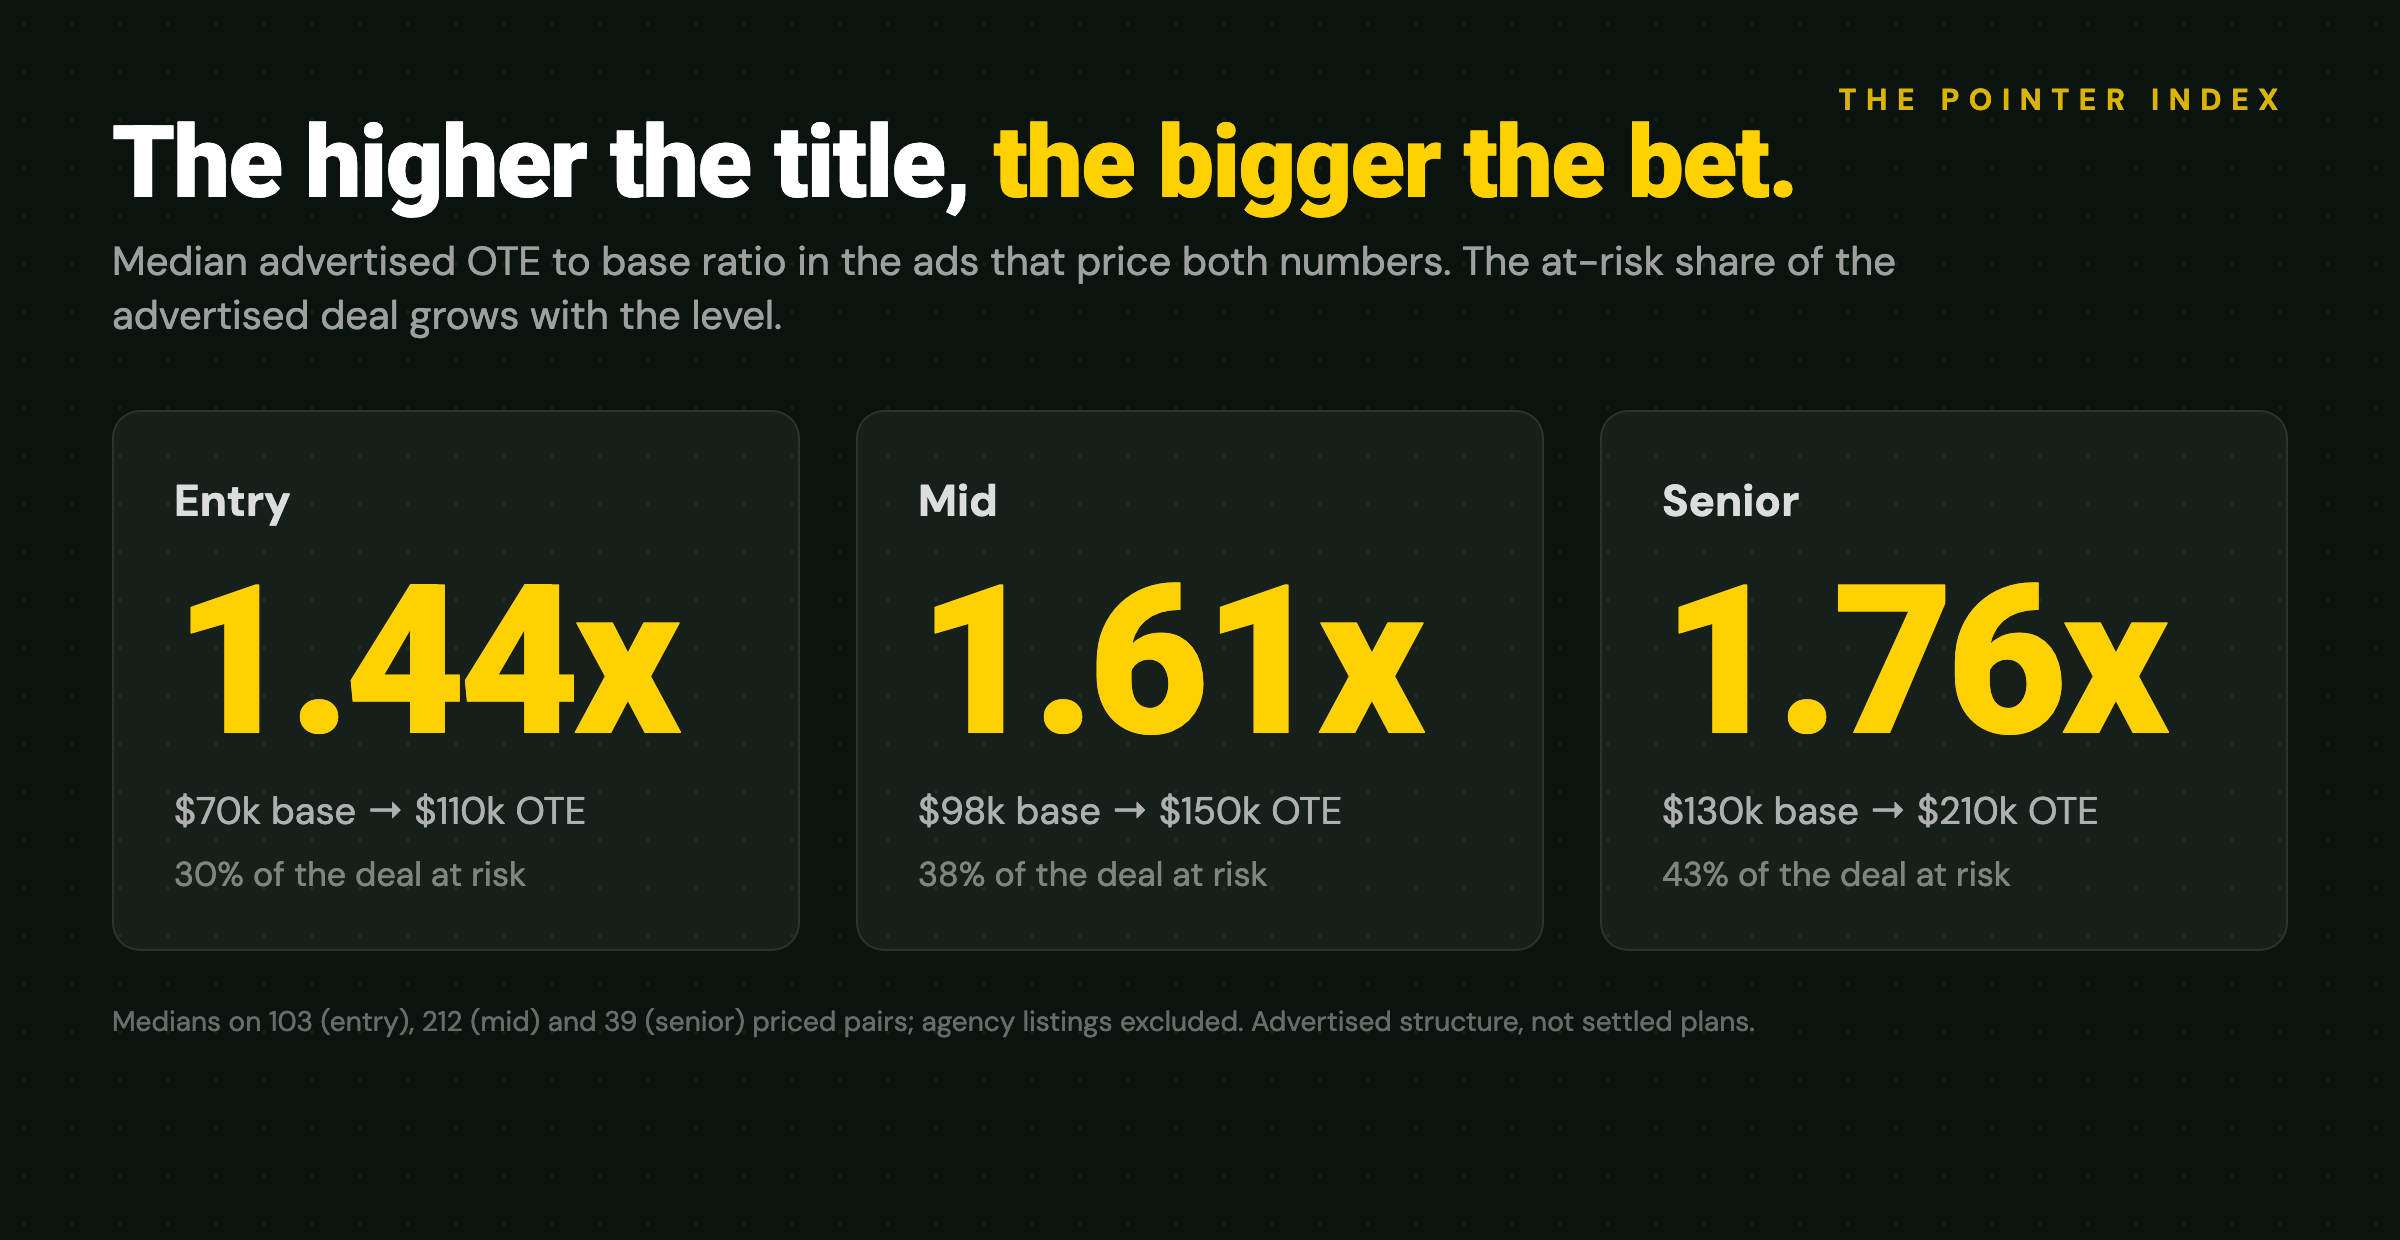
From the ads that price both numbers, the advertised structure of ANZ sales pay:
The ratio climbs with the level, which means the at-risk share of the deal climbs too. The market starts sellers near 70/30 and walks them toward 60/40 as the title grows. By role it tells the same story: SDR ads run 1.43x, account executive ads 1.64x with a $100,000 base against a $177,500 OTE.
We also cut this by industry, and we are not publishing that yet: once you demand both numbers in the same ad, most industry cells fall under our 30-listing threshold. Software runs at the market ratio on the sample we have. When the pool of priced ads grows, the industry ladder is the first thing we will print.
The 50/50 story and the 60/40 market
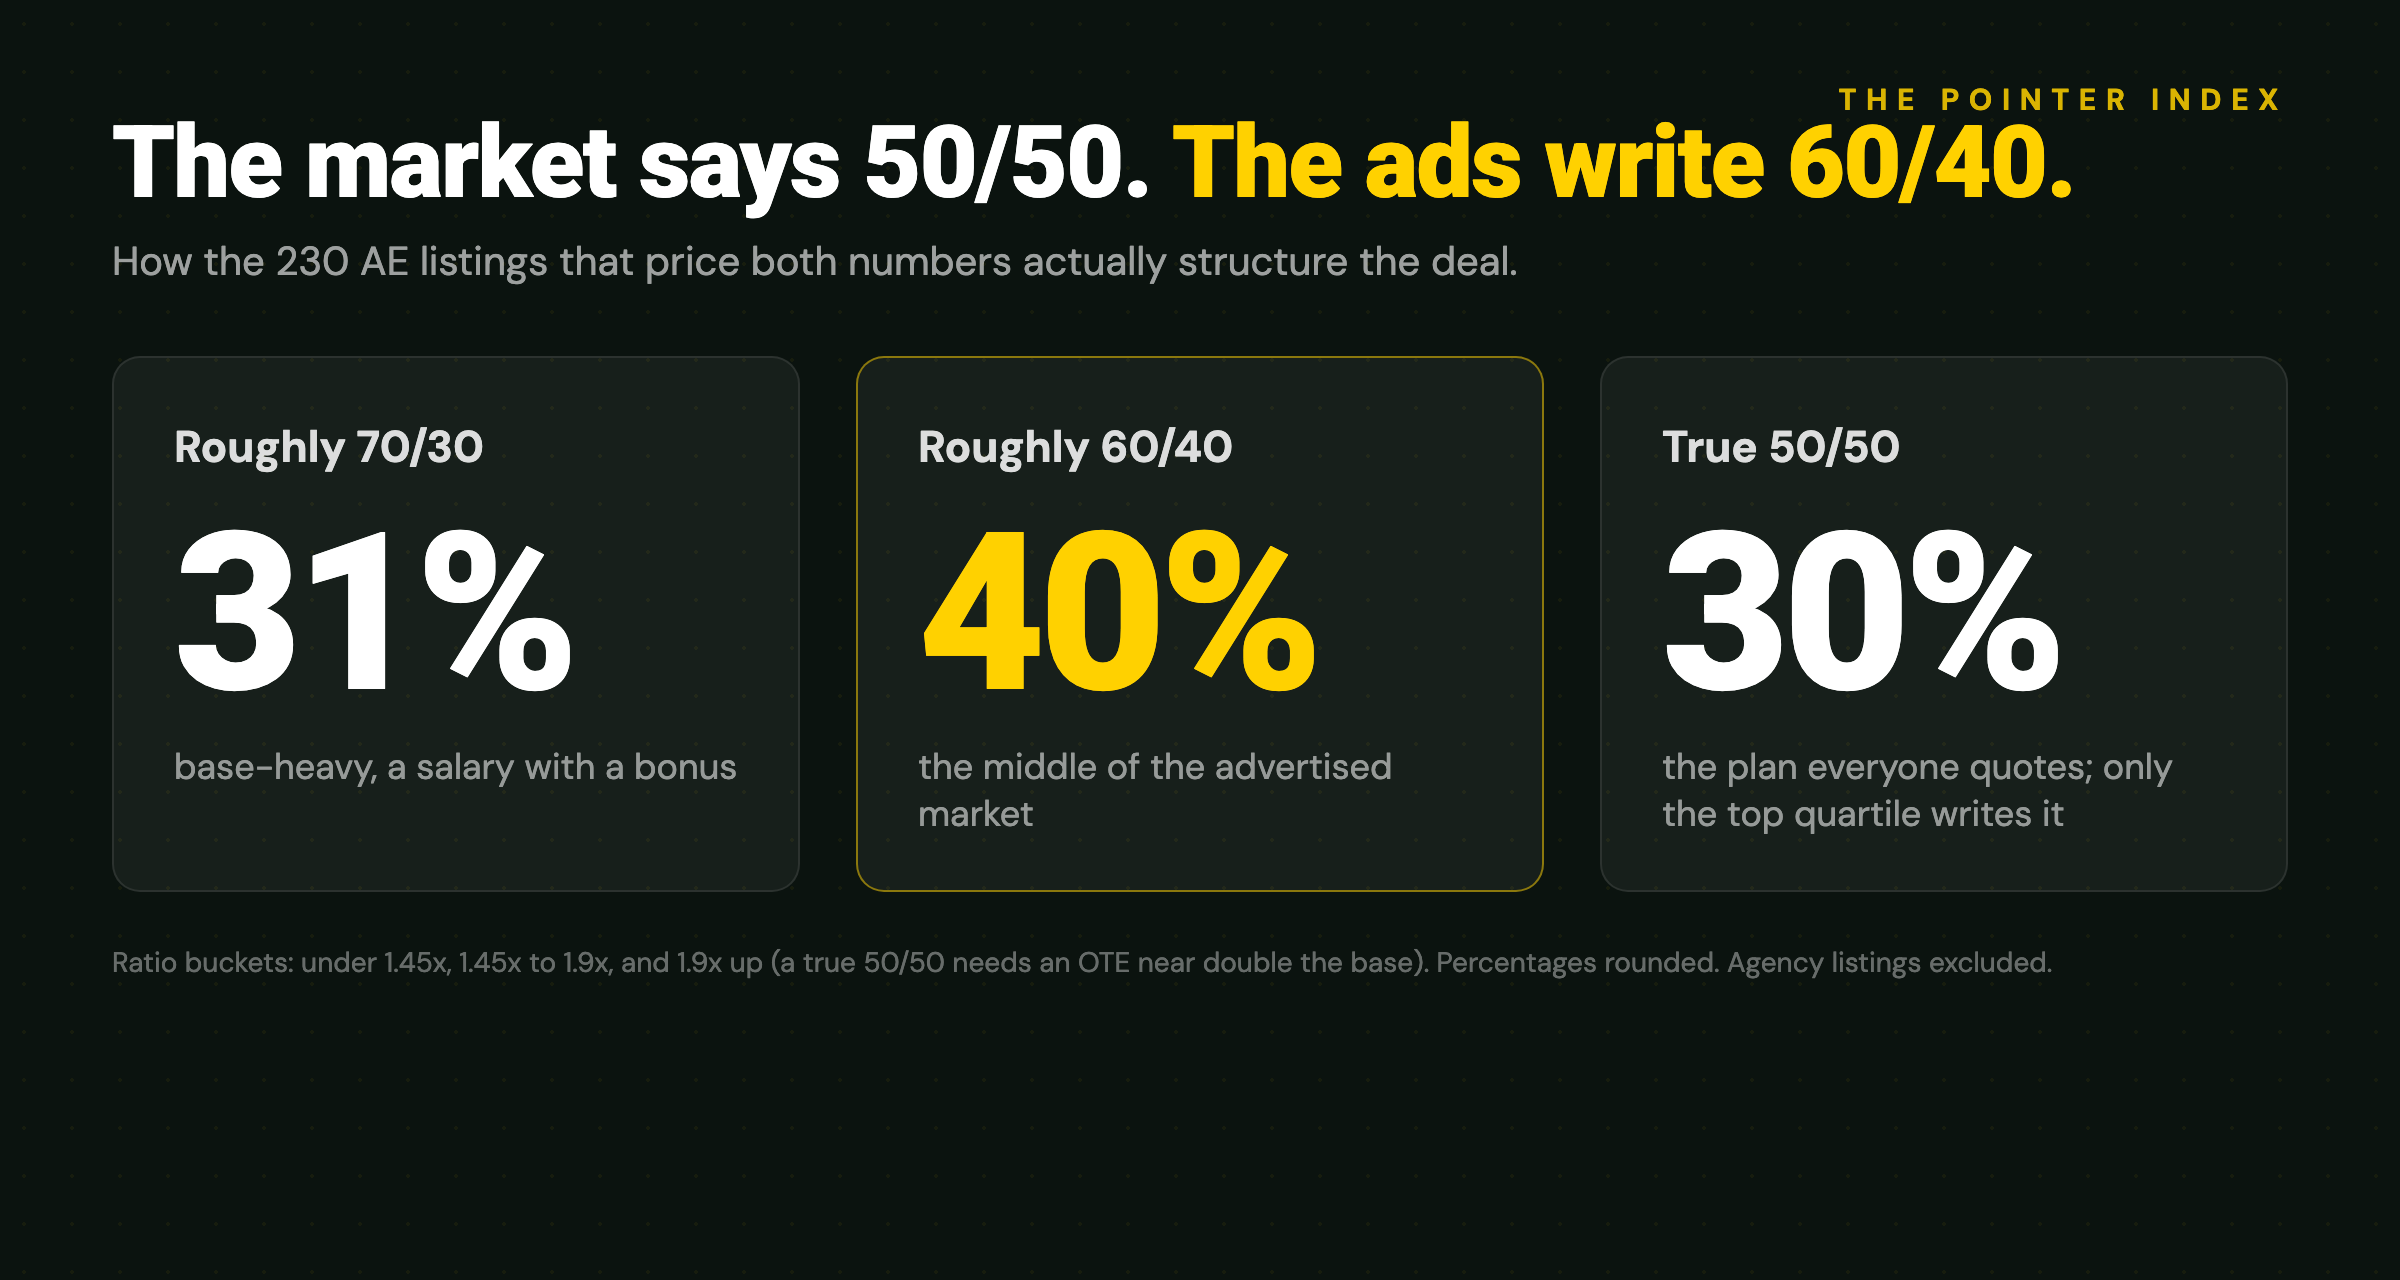
Ask anyone in SaaS what an AE plan looks like and you get the same answer: 50/50, half base, half variable. It is the split quoted in every comp guide, every VC benchmark deck, every recruiter conversation. The ads tell a different story.
Across the 230 account executive listings that price both numbers, only 30% are structured at or near a true 50/50, which needs an OTE around double the base. The median advertised AE deal is 1.64x, which is a 60/40. And another 31% sit below 1.45x, closer to 70/30, a salary with a bonus attached. The upper quartile of the market lands at exactly 2.0x, meaning 50/50 is the plan the top quarter of advertisers write, not the market standard everyone claims it is.
Read together with the disclosure gap, the picture sharpens. The 50/50 line survives as folklore partly because so few employers publish their split that nobody has to reconcile the story with the ads. When they do put numbers down, most of them choose to guarantee more and gear less. Whether that reflects a considered view that 60/40 wins the candidate, or just base inflation without matching OTE inflation, is a question the ads cannot answer. What they do answer is what the market actually writes when it writes anything at all, and it writes 60/40.
So what
If you are a CRO or revenue leader, the vagueness is a market condition you can play either side of. If you stay vague, know what it costs: your ad competes on base alone, and your $105,000 base is being read next to someone else's unpriced promise, which candidates discount heavily because they have learned to. If you go the other way, printing an OTE puts you in the 2.7% of the market that names the number, and printing the split puts you in a group of eight. That is the cheapest differentiation available in ANZ sales hiring right now, and it costs nothing you were not already going to pay.
On plan design, the ladder gives you the advertised benchmarks: 1.44x at entry, 1.61x at mid, 1.76x at senior, and for AEs specifically, the market writes 60/40 far more often than the 50/50 it talks about, so a 50/50 plan is a top-quartile gearing, not table stakes. A plan sitting well below those ratios reads as a salary with a tip. Well above, and candidates will assume the quota is fiction. The APAC sales compensation guide covers how to structure the plan itself, and the [OTE calculator](/tools/ote-calculator) will pressure-test any ratio against quota and deal maths. And if your offer letter says "uncapped" where a number should be, understand how that reads from the other side of the table: 284 employers made the same move this week, and a seller has no way to tell your genuine accelerator from their hand-waving.
One number to watch next week
The OTE disclosure rate: 2.7%. It is the most stable kind of number, a behaviour, not a price, so it will move slowly if it moves at all. That makes it the right benchmark to hold the market against. If pay transparency pressure reaches variable comp, it shows up here first. For the record, last issue's open question also resolved quietly: the headline base median printed $102,500, its first week above the $100,000 anchor, and everything we said about weekly medians applies to it. The comp that matters was never in that number anyway.
*Built from live ANZ data and updated continuously on the Pointer market data dashboard.*
*The small print. Comp structure is extracted from full ad text by our classification pipeline, live since early July across roughly 35,000 sales listings, current figures drawn from the 3,205 active sales listings this week with agencies excluded. "Mentions OTE or commission" is a whole-word text match on ote, on-target, commission or uncapped. The ratio ladder uses the 380 listings that price both a base and an OTE within sanity bounds; that is a self-selecting 1% of the sales listings we hold, and employers confident enough to print both numbers may run richer or leaner plans than the silent 99%, so treat the ratios as the advertised market's structure, not the settled one. The 50/50 analysis counts an AE ad as "at or near 50/50" from a ratio of 1.9x upward; its distribution rests on the 230 priced AE pairs (p25 1.38x, median 1.64x, p75 2.00x). Level medians rest on 103 (entry), 212 (mid) and 39 (senior) priced pairs; we do not publish a figure from fewer than 30. Industry cuts mostly fall under that threshold and are held back. Ratios describe advertised maximums where a range was given.*
*Methodology. "GTM" means Sales, Account Management, Marketing, CS, Presales, RevOps, Enablement, Partnerships, Growth, PMM, and GTM Engineering; this issue's analysis covers the Sales function. Numbers come from live ANZ job listings scraped from public records; recruitment agency listings are excluded throughout. The weekly market figures continue in the background: median advertised base $102,500 on 869 disclosed bands (14.5% transparency), active GTM pool 6,234, down 795 on the week, agency share 7.8%, AI or automation mentions 17.2% of listings. All figures are a point-in-time snapshot at the close of the reporting week, Sunday 19 July 2026, recorded in an insert-only weekly index that is never recomputed; the live dashboard updates continuously and may differ slightly. The tracker turned on in the week ending 5 April 2026. If a number looks wrong, reply to the newsletter or contact us. Corrections run in the next issue.*