

Issue 15 of The Pointer Index · Monthly round-up for July 2026 · Week ending 26 July 2026
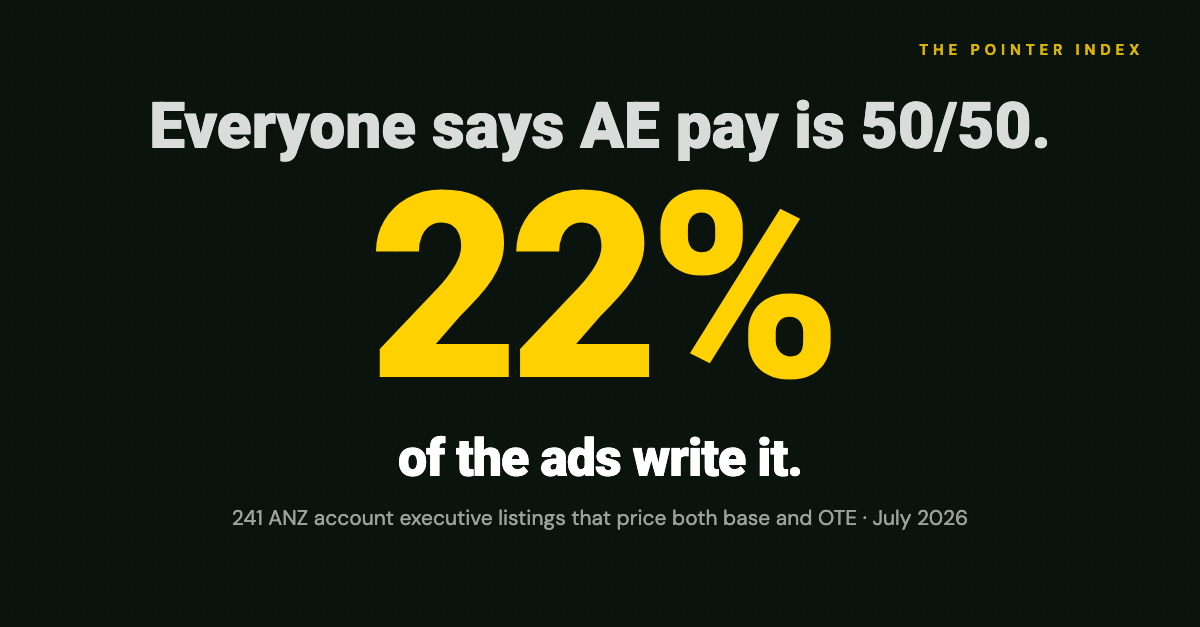
The question that came back most after last issue: is the 50/50 account executive plan, the one in every comp guide, what ANZ employers actually advertise? Among the sales ads that publish both halves of the deal, about one in five sits at or near that split. The rest sit either side of it, with the middle of the market a little leaner than the convention suggests.
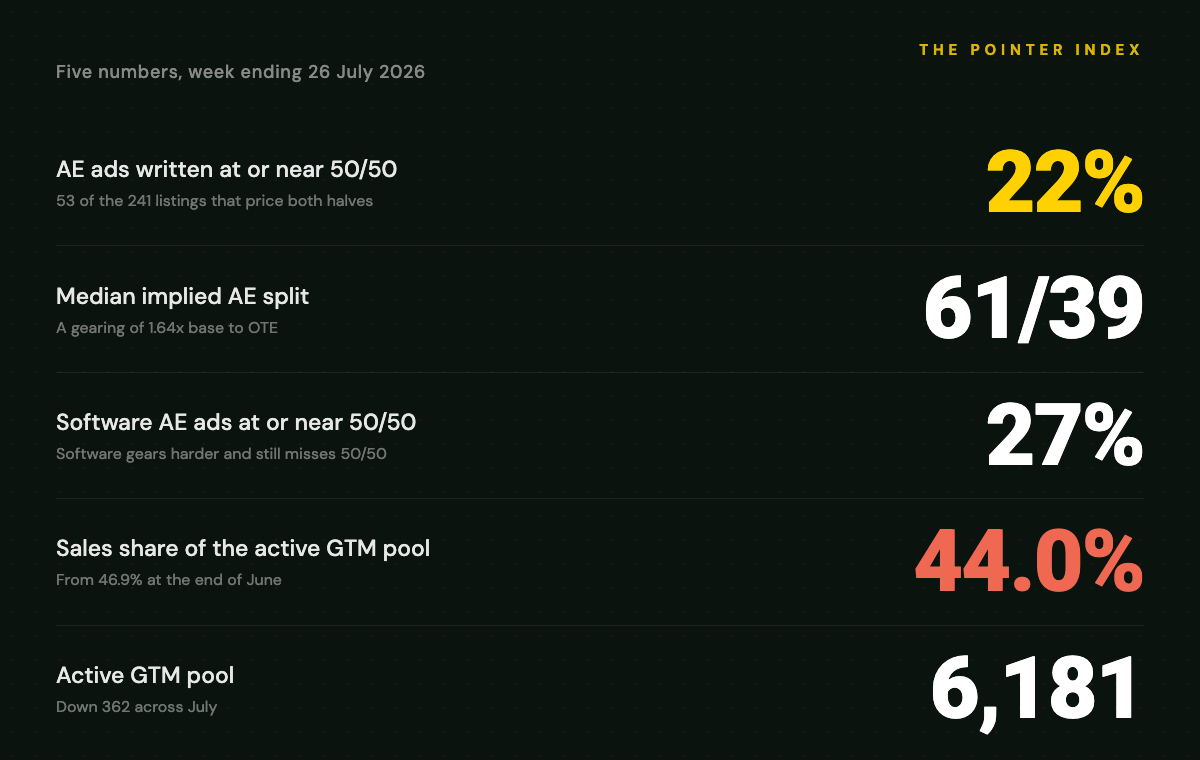
This is the July monthly. One index, five numbers, one observation.
The numbers
What an advertised AE plan looks like
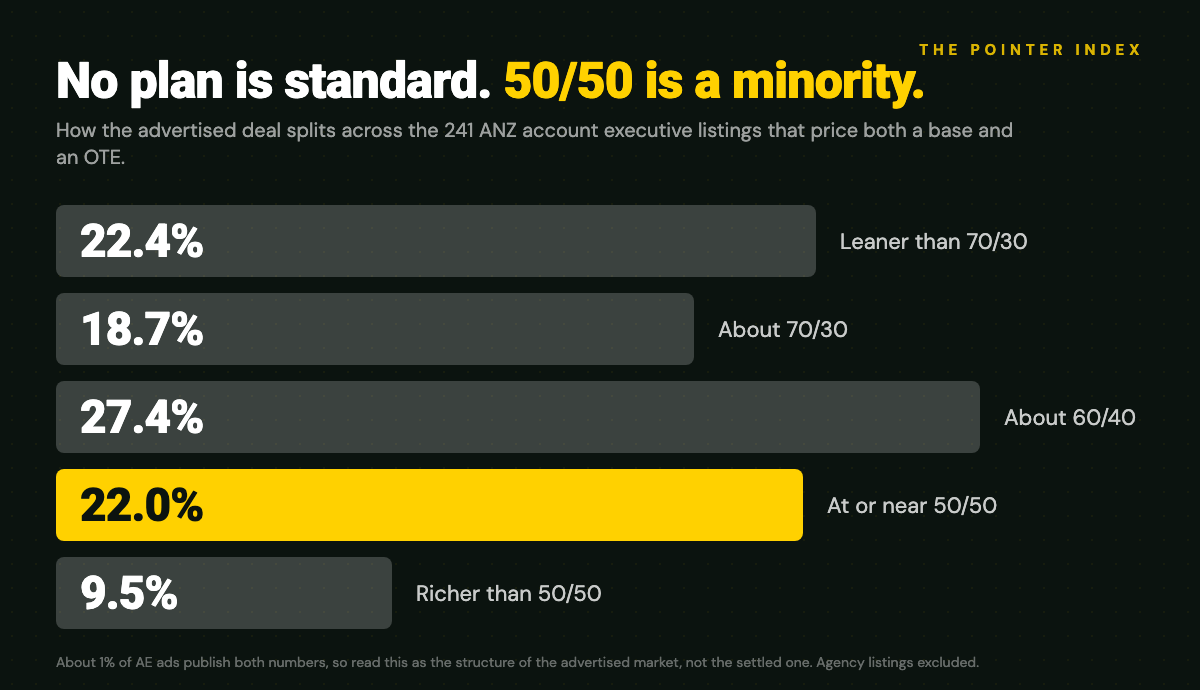
241 ANZ account executive listings price both a base and an OTE:
| Advertised split | Share |
|---|---|
| Leaner than 70/30 | 22.4% |
| About 70/30 | 18.7% |
| About 60/40 | 27.4% |
| At or near 50/50 | 22.0% |
| Richer than 50/50 | 9.5% |
No single design dominates. The 60/40 band is the largest, but only about five points clear of 50/50, which is inside the margin on a sample this size. What holds is narrower: a plan at or near 50/50 is a minority. Around 78% of these ads are written at something else, and 41% sit at 70/30 or leaner.
Is that just non-SaaS dragging the number down? It is not:
| Segment | Ads | Gearing | Base | OTE | At or near 50/50 |
|---|---|---|---|---|---|
| Software | 82 | 1.67x | $110,000 | $200,000 | 26.8% |
| Everything else | 159 | 1.54x | $95,000 | $150,000 | 19.5% |
Software advertises higher numbers on both the base and the OTE, and gears harder, and its middle still lands nearer 60/40. About one software AE ad in four sits at or near 50/50, so the convention describes a minority of disclosed software AE ads rather than the typical one.
One caveat is large enough to state plainly: ads that publish both numbers are about 1% of every AE listing we hold, and the silent 99% may run different plans. The APAC sales compensation guide covers how to build the plan itself, and the [OTE calculator](/tools/ote-calculator) will pressure-test any ratio against quota and deal maths.
What we are not calling
We also looked for movement over the last three months, and on the surface the at-risk half of the AE deal grew while the base held. We are not running it. The share of those ads at senior level went from under 10% in May to 22% in July, so part of the move is which ads disclosed rather than what employers pay. Hold the level steady and the mid-level base drifts down instead of holding, though the at-risk figure still rises. At around 65 ads a month, that is not enough to separate a real change from a change in the sample. We will look again in two months.
The mix moved toward the technical roles
In a pool that shrank by 362 over July, open sales listings fell by 347 and account management by 186. Growth rose by 130, presales by 93 and revops by 51. In share terms sales went from 46.9% of the pool to 44.0%, account management from 14.8% to 12.7%, while growth went from 1.4% to 3.5%, presales from 2.5% to 4.2% and revops from 1.2% to 2.1%.
Shifts like that are often about where the ads came from, so we checked by source. The technical share of new listings rose in all three channels: LinkedIn 8.2% to 10.5%, Seek 4.6% to 6.4%, career sites 6.0% to 10.5%. That is reasonable evidence of a real change, though sales and account management together gave up about five points while the three technical functions gained about 4.7, and a near offset like that is also what reclassification would look like.
The market in July
The active GTM pool ended July at 6,181, down from 6,543 at the end of June. Because reposted listings distort the weekly opening and closing counts, read the change in the pool rather than the churn.
The base median finished at $100,000, as it did in every week of June. The anchor that broke in issue 12 has ended July where it started. Transparency eased over the final three weeks to 13.82%, the lowest we have recorded, though weekly readings are noisy.
Agency share 7.70%, days on market 4.0, AI mentions 17.97%. Function medians: sales $100,000, account management $103,750, marketing $90,000.
So what
If you are a revenue leader, there is more variety in advertised AE plans than the standard advice implies. A fifth of the disclosed market writes at or near 50/50 and two fifths write 70/30 or leaner. That does not make 50/50 wrong, but you are choosing a position rather than matching a standard, and it is worth choosing it deliberately.
If you are a seller, the base is the part you can rely on. Ask what the quota is, what share of the team hit it last year, and how the ramp works.
One number to watch next month
Salary transparency: 13.82%. Three weeks of easing to the lowest point we have recorded. Weekly readings bounce around, so another soft month would tell us more than any single reading does. It matters because the advertised base is doing most of the work in a candidate's comparison right now.
The short version
As of the week ending 26 July 2026, the 50/50 account executive plan is a minority design in ANZ. Of the 241 AE listings that price both a base and an OTE, 22% are written at or near 50/50, 27.4% at about 60/40, and 41% at 70/30 or leaner. The median implied split is 61/39. Software gears harder than the rest of the market, with a median of 1.67x against 1.54x, and still only about one software AE ad in four is a true 50/50. The active GTM pool ended July at 6,181, down 362 across the month, with sales falling to 44.0% of the pool while growth, presales and revops all added listings.
*Built from live ANZ data and updated continuously on the Pointer market data dashboard.*
*The small print. Gearing figures rest on 241 ANZ account executive listings, agencies excluded, where our pipeline extracted both an advertised base and an advertised OTE. That pool is drawn from every AE listing we have recorded rather than the active ones alone, 22,932 in total, so the priced sample is about 1% of AE ads. Employers willing to print both numbers may run different plans from the silent 99%, and that is the largest caveat on the figures above: read them as the structure of the advertised market, not the settled one. Sanity bounds: base $40,000 to $500,000, OTE $40,000 to $1,000,000, OTE at or above base, ratio at or below 4x. Ratios use advertised maximums where a range was given. "At-risk" is the variable share of the deal, calculated per ad as (OTE minus base) divided by OTE. Split bands are a variable share of 25% to under 35% for 70/30, 35% to under 45% for 60/40, and 45% to 55% inclusive for 50/50. On 241 ads the margin around a share near 22% is roughly five points, so the 60/40 and 50/50 bands cannot be ranked with confidence. The three-month comparison uses 62, 70 and 67 priced AE ads grouped by the month we first saw them; comp extraction was backfilled across the historical corpus on 7 and 8 July, covering 6,291 of 6,291 May AE ads, 6,409 of 6,409 in June and 6,142 of 6,145 in July. The software segment is flagged from company industry, tech classification and listing sector. Cells below 30 ads are not published.*
*Methodology. "GTM" means Sales, Account Management, Marketing, CS, Presales, RevOps, Enablement, Partnerships, Growth, PMM, and GTM Engineering. Numbers come from live ANZ job listings scraped from public records. Recruitment agency listings are excluded from every figure here except the agency share itself, which is measured against the full pool before that exclusion. "July" is the four reporting weeks ending 5, 12, 19 and 26 July, and figures quoted for the month are individual weekly readings rather than a pooled monthly rate. We publish the size of the active pool rather than a monthly net, because a listing that closes and later reposts has its closing date cleared, so weekly opening and closing counts overstate turnover and do not sum to the change in the pool. Salary medians are published from 50 or more disclosed AUD bands, labelled directional between 30 and 50, and suppressed below 30; growth, revops, presales and partnerships are suppressed this month on that rule. The AI and automation metric had methodology changes on 8 and 24 June, so it is only compared within July. Unless otherwise stated, market-index figures are a point-in-time snapshot at the close of the reporting week, Sunday 26 July 2026, recorded in an insert-only weekly index that is never recomputed; the AE gearing analysis and the source-mix comparison are drawn from the historical corpus instead. The live dashboard updates continuously and may differ slightly. The tracker turned on in the week ending 5 April 2026. If a number looks wrong, reply to the newsletter or contact us. Corrections run in the next issue.*