

Issue 24 of The Pointer Index · Week ending 27 September 2026
Most "who's hiring" lists start with 100 companies the author has heard of and a LinkedIn headcount lookup. This one starts from the ads: every direct-employer GTM ad in Australia and New Zealand over the 90 days to 22 September, counted twice, once as posted and once with the copies removed. The list is ranked on the second count.
The quarter in five numbers
62,163 GTM ads from direct employers, 45,864 of them unique once the copies are removed. They came from 17,246 employers, ten of which posted a hundred or more unique ads. The top 100 employers account for 11.9% of the market, and at that level one ad in two is a copy: 10,529 ads, 5,464 unique. Median advertised base is $100,000, where it was last quarter and the quarter before.
Total ads, unique ads, and why we rank on the second
The same ad goes up once per city on LinkedIn, again on Seek, again on the careers site, then again when it is refreshed. Stryker posted 384 ads this quarter; 73 were unique. Amazon posted 653; 334 were unique.
Every employer here gets both numbers. Unique ads are what is left after the copies come out: distinct requisition links where we have the employer's careers site, otherwise distinct posting weeks per title, so twelve city versions of one ad in one week count once and the same title back three weeks later counts again. A unique ad is still not a headcount. It might be filling one seat or six, and the ad does not say.
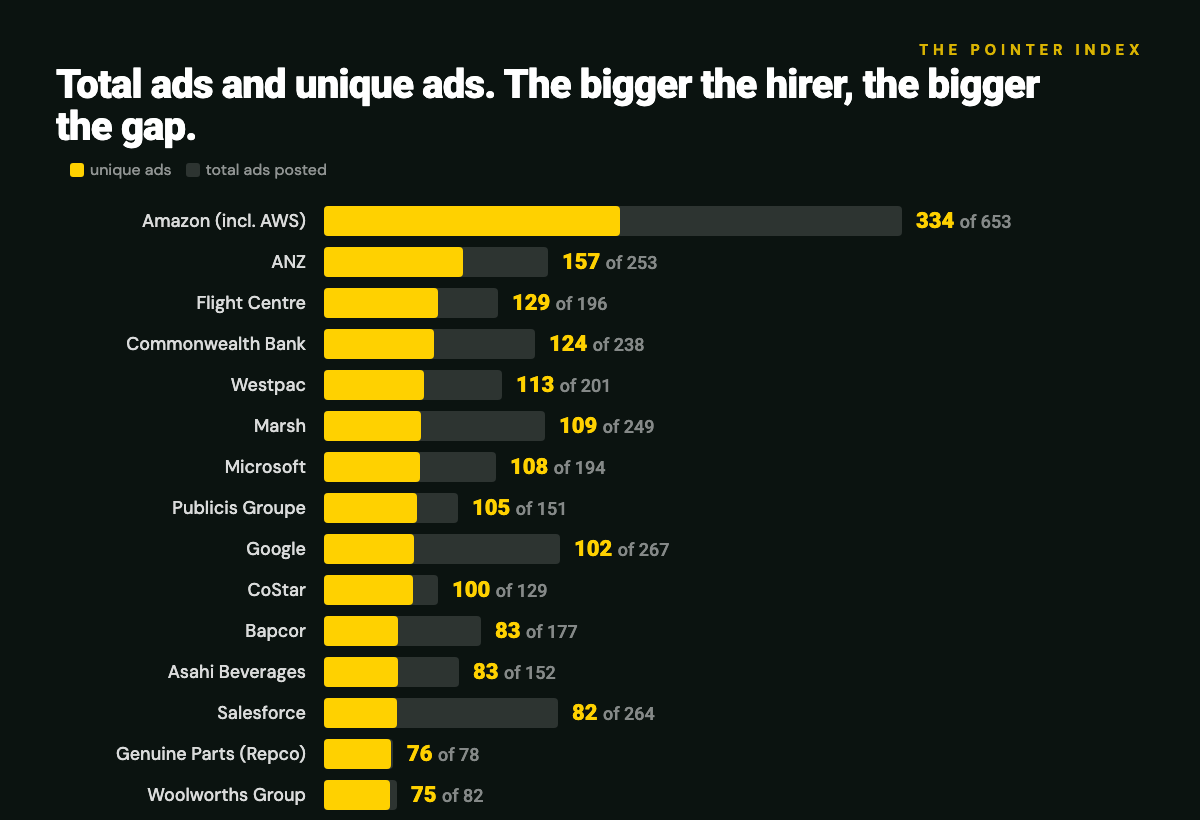
The gap is different for every employer. Genuine Parts (Repco) posted 78 ads and 76 were unique. Stryker's multiple was 5.3, Salesforce's 3.2, Google's 2.6. In this table the gap runs from almost nothing to more than five times, so a competitor sized from a job feed can be out by any amount in that range.
The 100 biggest tech GTM hirers
Most people reading this hire in tech, so here is the same count with everyone else taken out. Tech here means software, internet platforms, cloud and infrastructure, cybersecurity, IT services and resellers, payments and fintech infrastructure, and the telcos. Medical devices, banks, lenders, trading platforms and media companies are out.
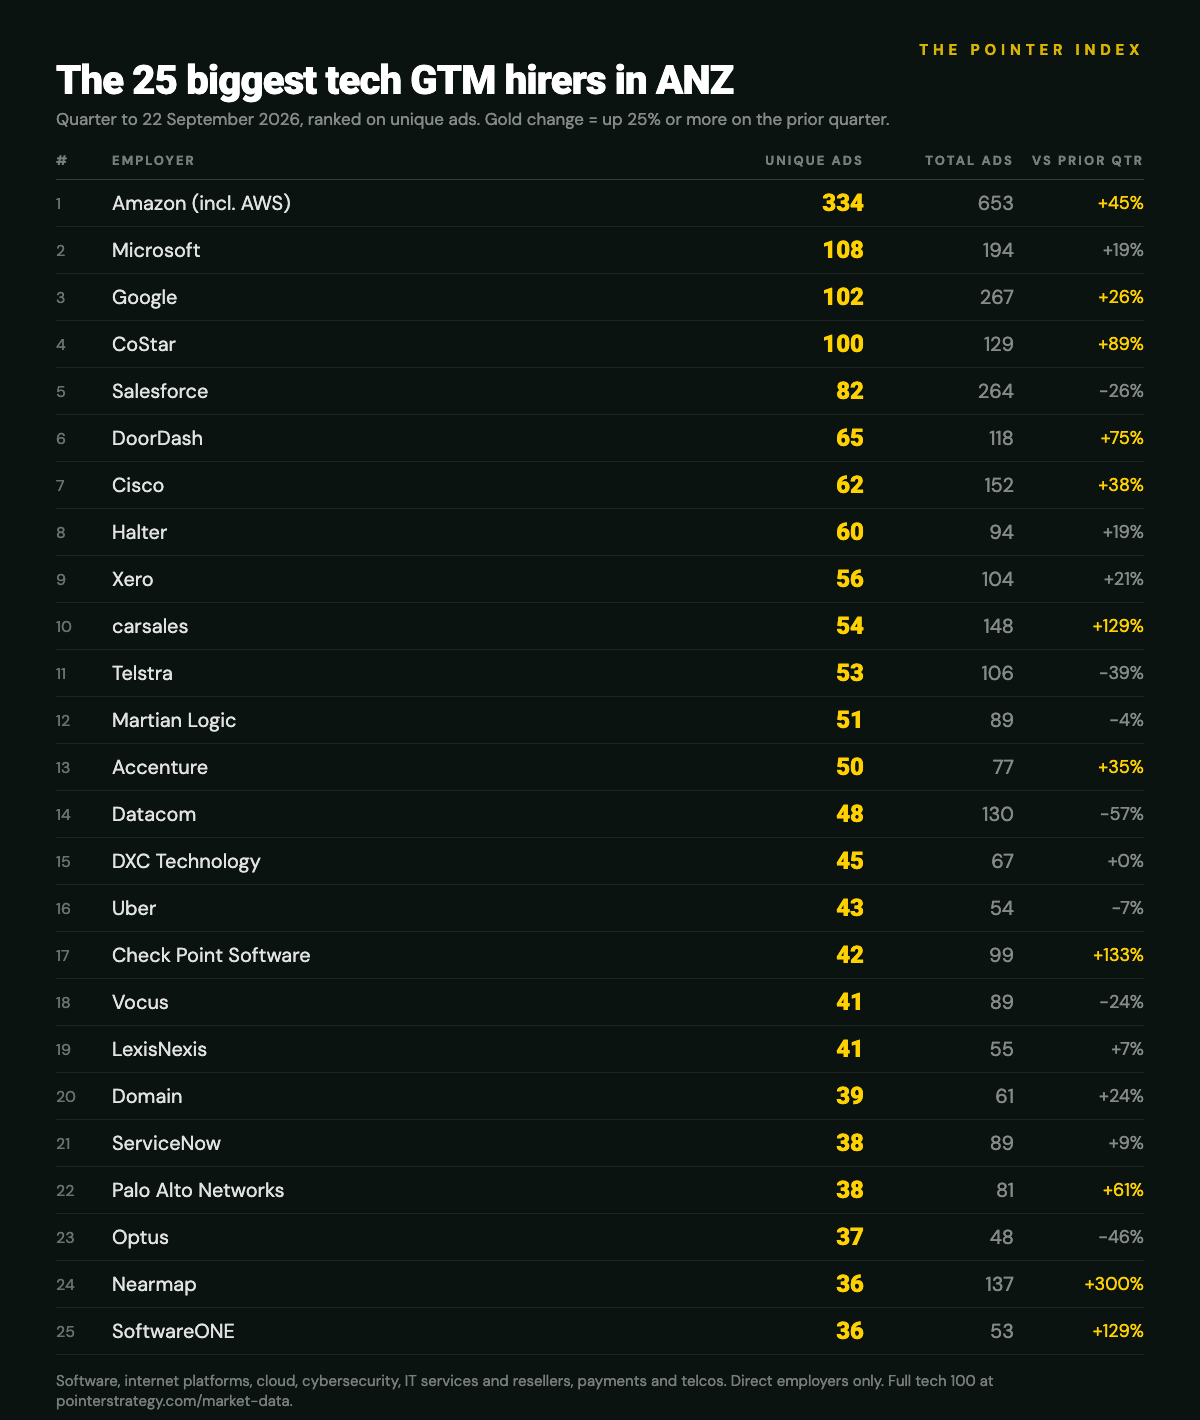
Employers our company data flags as tech posted 10,346 unique GTM ads this quarter, 22.6% of the market, from 2,650 companies. That flag is a rougher instrument than the definition above (it leaves out the telcos and lets in some financial and medical firms), so read it as the size of the sector, not of this table. The 100 below were checked by hand. They posted 3,200 unique ads from 6,232, so the copy rate matches the overall list: one in two. Hundredth place is 14 unique ads.
| # | Employer | Unique ads | Total ads | vs prior qtr | Main function | Basis |
|---|---|---|---|---|---|---|
| 1 | Amazon (incl. AWS) | 334 | 653 | +45% | Sales 28% | Mixed |
| 2 | Microsoft | 108 | 194 | +19% | Sales 39% | Careers site |
| 3 | 102 | 267 | +26% | Presales 25% | Careers site | |
| 4 | CoStar | 100 | 129 | +89% | Marketing 29% | Careers site |
| 5 | Salesforce | 82 | 264 | -26% | Sales 67% | Careers site |
| 6 | DoorDash | 65 | 118 | +75% | Sales 23% | Careers site |
| 7 | Cisco | 62 | 152 | +38% | Sales 35% | Careers site |
| 8 | Halter | 60 | 94 | +19% | Sales 47% | Careers site |
| 9 | Xero | 56 | 104 | +21% | Marketing 27% | Careers site |
| 10 | carsales | 54 | 148 | +129% | Customer success 33% | Careers site |
| 11 | Telstra | 53 | 106 | -39% | Account mgmt 32% | Careers site |
| 12 | Martian Logic | 51 | 89 | -4% | Sales 65% | Estimate |
| 13 | Accenture | 50 | 77 | +35% | Marketing 34% | Careers site |
| 14 | Datacom | 48 | 130 | -57% | Sales 38% | Mixed |
| 15 | DXC Technology | 45 | 67 | +0% | Sales 58% | Mixed |
| 16 | Uber | 43 | 54 | -7% | Sales 42% | Estimate |
| 17 | Check Point Software | 42 | 99 | +133% | Sales 48% | Careers site |
| 18 | Vocus | 41 | 89 | -24% | Sales 34% | Careers site |
| 19 | LexisNexis | 41 | 55 | +7% | Sales 39% | Estimate |
| 20 | Domain | 39 | 61 | +24% | Marketing 26% | Estimate |
| 21 | ServiceNow | 38 | 89 | +9% | Presales 34% | Careers site |
| 22 | Palo Alto Networks | 38 | 81 | +61% | Presales 37% | Careers site |
| 23 | Optus | 37 | 48 | -46% | Sales 65% | Estimate |
| 24 | Nearmap | 36 | 137 | +300% | Marketing 39% | Careers site |
| 25 | SoftwareONE | 36 | 53 | +129% | Sales 33% | Estimate |
| 26 | REA Group | 34 | 102 | +89% | Marketing 29% | Careers site |
| 27 | Resonate CX | 34 | 97 | +44% | Sales 74% | Estimate |
| 28 | Square (Block) | 34 | 66 | -18% | Sales 56% | Careers site |
| 29 | Fever | 33 | 58 | -33% | Sales 33% | Careers site |
| 30 | Mastercard | 32 | 67 | +29% | Sales 25% | Careers site |
| 31 | TikTok | 32 | 44 | +42% | Marketing 50% | Estimate |
| 32 | Stripe | 31 | 67 | -31% | Sales 58% | Mixed |
| 33 | GitLab | 31 | 37 | -11% | Sales 48% | Mixed |
| 34 | Easygo | 29 | 47 | -5% | Marketing 52% | Careers site |
| 35 | Databricks | 29 | 40 | -44% | Presales 45% | Mixed |
| 36 | Canva | 27 | 71 | -27% | Marketing 63% | Careers site |
| 37 | Tyro | 27 | 67 | +20% | Partnerships 22% | Careers site |
| 38 | Oracle | 27 | 60 | +140% | Sales 67% | Careers site |
| 39 | Data#3 | 27 | 32 | -14% | Sales 52% | Estimate |
| 40 | Odoo | 26 | 27 | +10% | Sales 46% | Estimate |
| 41 | Cloudflare | 25 | 30 | +17% | Sales 52% | Mixed |
| 42 | Airwallex | 24 | 71 | -41% | Sales 50% | Careers site |
| 43 | EatClub | 24 | 54 | -3% | Sales 46% | Careers site |
| 44 | Pax8 | 24 | 51 | +7% | Partnerships 58% | Careers site |
| 45 | MYOB | 24 | 48 | -11% | Sales 29% | Careers site |
| 46 | Podium | 23 | 37 | +36% | Sales 52% | Mixed |
| 47 | TechnologyOne | 23 | 28 | +127% | Customer success 52% | Estimate |
| 48 | Dicker Data | 23 | 23 | +192% | Sales 52% | Estimate |
| 49 | Fusion5 | 22 | 43 | +50% | Sales 27% | Estimate |
| 50 | Too Good To Go | 22 | 41 | +9% | Sales 100% | Careers site |
| 51 | Sitemate | 22 | 40 | +96% | Sales 73% | Careers site |
| 52 | Hewlett Packard Enterprise | 22 | 35 | -42% | Sales 45% | Careers site |
| 53 | Netskope | 22 | 28 | +96% | Presales 45% | Mixed |
| 54 | Heidi Health | 21 | 46 | +17% | Customer success 33% | Careers site |
| 55 | One New Zealand | 21 | 39 | +133% | Marketing 33% | Careers site |
| 56 | Diligent | 21 | 32 | -25% | Sales 43% | Mixed |
| 57 | UpGuard | 20 | 86 | +48% | Customer success 30% | Careers site |
| 58 | Workday | 20 | 44 | -11% | Customer success 45% | Careers site |
| 59 | Exclusive Networks | 20 | 35 | -29% | Sales 65% | Careers site |
| 60 | World Wide Technology | 20 | 23 | +48% | Sales 40% | Estimate |
| 61 | NetApp | 19 | 60 | -1% | Sales 32% | Mixed |
| 62 | Atlassian | 19 | 60 | -16% | Sales 37% | Careers site |
| 63 | CrowdStrike | 19 | 52 | -20% | Sales 37% | Careers site |
| 64 | AvePoint | 19 | 38 | +21% | Sales 37% | Careers site |
| 65 | HubSpot | 19 | 37 | -1% | Sales 63% | Careers site |
| 66 | SAP | 19 | 29 | -69% | Presales 37% | Careers site |
| 67 | Compass Education | 18 | 41 | +23% | Customer success 56% | Mixed |
| 68 | Atturra | 18 | 32 | +167% | Sales 22% | Careers site |
| 69 | NCS | 18 | 21 | -36% | Sales 50% | Estimate |
| 70 | Tech Data | 18 | 18 | +167% | Sales 33% | Estimate |
| 71 | Fujitsu | 17 | 35 | +8% | Sales 65% | Estimate |
| 72 | Agilitus | 17 | 30 | -53% | Growth 41% | Mixed |
| 73 | Snowflake | 17 | 25 | -53% | Presales 47% | Mixed |
| 74 | ELMO Software | 17 | 18 | +16% | Customer success 29% | Estimate |
| 75 | Aussie Broadband | 16 | 32 | -25% | Marketing 44% | Careers site |
| 76 | 16 | 32 | +184% | Sales 38% | Careers site | |
| 77 | Ebury | 16 | 30 | +58% | Sales 94% | Careers site |
| 78 | CORTO | 16 | 28 | +58% | Customer success 50% | Careers site |
| 79 | FICO | 16 | 27 | +42% | Customer success 50% | Mixed |
| 80 | IBM | 16 | 22 | -60% | Sales 56% | Estimate |
| 81 | HungryPanda | 16 | 19 | +184% | Marketing 44% | Estimate |
| 82 | TPG Telecom | 16 | 17 | -11% | Marketing 31% | Estimate |
| 83 | UKG | 15 | 38 | +48% | Sales 53% | Careers site |
| 84 | First Focus | 15 | 33 | -17% | Sales 33% | Mixed |
| 85 | Experian | 15 | 32 | -42% | Customer success 40% | Careers site |
| 86 | NinjaOne | 15 | 30 | +33% | Sales 67% | Careers site |
| 87 | Mable | 15 | 28 | +90% | Marketing 53% | Careers site |
| 88 | OpenText | 15 | 27 | -30% | Sales 67% | Careers site |
| 89 | Sage | 15 | 17 | +344% | Sales 33% | Mixed |
| 90 | KPay | 15 | 15 | -11% | Sales 40% | Estimate |
| 91 | Humanforce | 15 | 15 | -26% | Sales 47% | Estimate |
| 92 | SS&C Technologies | 14 | 36 | +13% | Sales 43% | Mixed |
| 93 | MRI Software | 14 | 32 | +4% | Sales 36% | Careers site |
| 94 | Okta | 14 | 29 | -4% | Sales 43% | Careers site |
| 95 | Nexon | 14 | 27 | +56% | Sales 43% | Estimate |
| 96 | Ideagen | 14 | 23 | +38% | Customer success 43% | Careers site |
| 97 | Visa | 14 | 21 | -57% | Sales 29% | Mixed |
| 98 | InfoTrack | 14 | 20 | +522% | Account mgmt 50% | Careers site |
| 99 | Legora | 14 | 18 | +522% | Customer success 43% | Mixed |
| 100 | Avanade | 14 | 14 | +149% | Sales 29% | Estimate |
Amazon posted more unique GTM ads than Microsoft, Google and CoStar combined. The four hyperscalers (AWS, Microsoft, Google, Oracle) posted 571 between them, up 38% on the prior quarter.
Seven security vendors in the table posted 180 unique ads, up 43%: Check Point more than doubled, Netskope nearly doubled, Palo Alto is up 61% and UpGuard 48%, while CrowdStrike is down 20% and Okta flat. The eighteen US application-software names went the other way, from 530 to 438 unique ads. SAP fell 69%, Snowflake 53%, Databricks 44% and Salesforce 26%, while ServiceNow and HubSpot are within 10% of where they were and Workday is down 11%.
Inside the channel, services and distribution moved in opposite directions. Nineteen IT services firms, resellers and distributors posted 467 unique ads, down 6% in total, with the services side falling (Datacom down 57%, IBM down 60%, NCS down 36%) and the distributors rising (Dicker Data up 192%, Tech Data up 167%, SoftwareONE up 129%, Atturra up 167%). Six telcos posted 184, down 29%, with One New Zealand the exception at more than double.
Thirty-seven of the 100 are headquartered in Australia or New Zealand, counting the telcos: 35 by their LinkedIn profiles, plus Canva and Atlassian, whose profiles list no headquarters. They posted 1,043 unique ads, up 2%. Halter, an Auckland agtech company, is eighth with 60. carsales more than doubled to 54. Nearmap quadrupled to 36 unique ads and posted 137 ads to get there. Atlassian posted 19 unique GTM ads in ANZ over the quarter, 62nd on the list, and Canva posted 27, down 27%.
The tech 100 hires into different functions from the rest of the market. Sales is 36% of its unique ads against 42% market-wide. Presales is 13% against 3%, customer success 11% against 5%, marketing 11% against 25%. AI appears in the title of 117 of the 3,200, and 62 of those are presales, where it is one title in seven.
Tech ads that print a salary show a median base midpoint of $120,000 on 893 ads, against $104,000 at employers we classify as non-tech on 2,039 ads. In sales the gap is $110,000 to $105,000; in marketing $111,750 to $100,900, where the tech sample is only 132 ads. A further 5,710 disclosing ads come from employers we have not classified either way and are left out of the comparison. These are levels from the minority of ads that print a range.
The 100 biggest GTM hirers in ANZ, all industries
Ranked on unique ads. The change column compares unique ads with the previous quarter on a weekly-rate basis. "Basis" says whether the unique count comes from the employer's careers site or is inferred from board postings.
| # | Employer | Unique ads | Total ads | vs prior qtr | Main function | Where | Basis |
|---|---|---|---|---|---|---|---|
| 1 | Amazon (incl. AWS) | 334 | 653 | +45% | Sales 28% | Sydney, Melbourne | Mixed |
| 2 | ANZ | 157 | 253 | +50% | Account mgmt 72% | Melbourne, Sydney | Careers site |
| 3 | Flight Centre | 129 | 196 | +1% | Sales 33% | Brisbane, Melbourne | Careers site |
| 4 | Commonwealth Bank | 124 | 238 | +33% | Account mgmt 53% | Sydney, Melbourne | Careers site |
| 5 | Westpac | 113 | 201 | +70% | Account mgmt 66% | Melbourne, Sydney | Careers site |
| 6 | Marsh | 109 | 249 | +18% | Account mgmt 73% | Sydney, Melbourne | Mixed |
| 7 | Microsoft | 108 | 194 | +19% | Sales 39% | Sydney, Auckland | Careers site |
| 8 | Publicis Groupe | 105 | 151 | +24% | Marketing 60% | Sydney, Melbourne | Careers site |
| 9 | 102 | 267 | +26% | Presales 25% | Sydney, Melbourne | Careers site | |
| 10 | CoStar | 100 | 129 | +89% | Marketing 29% | Sydney, Melbourne | Careers site |
| 11 | Bapcor | 83 | 177 | +64% | Sales 72% | Melbourne, Brisbane | Careers site |
| 12 | Asahi Beverages | 83 | 152 | +34% | Sales 58% | Melbourne, Brisbane | Careers site |
| 13 | Salesforce | 82 | 264 | -26% | Sales 67% | Sydney, Melbourne | Careers site |
| 14 | Genuine Parts (Repco) | 76 | 78 | -5% | Sales 58% | Melbourne, Sydney | Careers site |
| 15 | Woolworths Group | 75 | 82 | +17% | Marketing 48% | Sydney, Auckland | Estimate |
| 16 | Stryker | 73 | 384 | +25% | Sales 73% | Brisbane, Sydney | Mixed |
| 17 | Johnson & Johnson | 70 | 168 | -6% | Sales 59% | Sydney, Brisbane | Careers site |
| 18 | DuluxGroup | 70 | 117 | +5% | Sales 67% | Melbourne, Brisbane | Estimate |
| 19 | NAB | 69 | 166 | +30% | Account mgmt 77% | Sydney, Brisbane | Estimate |
| 20 | Southern Cross Austereo | 65 | 120 | -28% | Sales 42% | Melbourne, Brisbane | Careers site |
| 21 | DoorDash | 65 | 118 | +75% | Sales 23% | Melbourne, Sydney | Careers site |
| 22 | Gallagher | 64 | 148 | +35% | Sales 39% | Hamilton, Sydney | Careers site |
| 23 | Cotton On Group | 64 | 99 | +67% | Marketing 53% | Geelong, Regional VIC | Mixed |
| 24 | Accor | 64 | 85 | -7% | Sales 50% | Sydney, Melbourne | Careers site |
| 25 | Cisco | 62 | 152 | +38% | Sales 35% | Melbourne, North Sydney | Careers site |
| 26 | News Corp Australia | 62 | 132 | +38% | Marketing 56% | Sydney, Melbourne | Mixed |
| 27 | Halter | 60 | 94 | +19% | Sales 47% | Auckland, Brisbane | Careers site |
| 28 | Aon | 58 | 134 | -1% | Account mgmt 74% | Sydney, Auckland | Careers site |
| 29 | Xero | 56 | 104 | +21% | Marketing 27% | Auckland, Melbourne | Careers site |
| 30 | carsales | 54 | 148 | +129% | Customer success 33% | Melbourne, Sydney | Careers site |
| 31 | Telstra | 53 | 106 | -39% | Account mgmt 32% | Sydney, Melbourne | Careers site |
| 32 | Nine | 53 | 78 | +105% | Sales 42% | Sydney, Melbourne | Estimate |
| 33 | Bayer | 52 | 83 | +362% | Sales 87% | Pymble, Melbourne | Careers site |
| 34 | Wurth Australia | 52 | 55 | +44% | Sales 100% | Sydney, Regional VIC | Estimate |
| 35 | Martian Logic | 51 | 89 | -4% | Sales 65% | Sydney | Estimate |
| 36 | Schneider Electric | 50 | 145 | +8% | Sales 52% | Melbourne, Sydney | Careers site |
| 37 | Accenture | 50 | 77 | +35% | Marketing 34% | Sydney, Melbourne | Careers site |
| 38 | TMGM | 49 | 102 | +118% | Account mgmt 69% | Sydney, Adelaide | Mixed |
| 39 | Coca-Cola Europacific | 49 | 86 | -11% | Sales 84% | Sydney, Melbourne | Estimate |
| 40 | Omnicom Media Group | 49 | 53 | -5% | Marketing 49% | Sydney, Melbourne | Estimate |
| 41 | Datacom | 48 | 130 | -57% | Sales 38% | Auckland, Adelaide | Mixed |
| 42 | ARN | 48 | 107 | +4% | Marketing 35% | Sydney, North Sydney | Careers site |
| 43 | EVT Group | 47 | 55 | +23% | Sales 55% | Sydney, Snowy Monaro Regional Council | Careers site |
| 44 | ZURU | 47 | 55 | +55% | Marketing 66% | Auckland, Sydney | Careers site |
| 45 | DXC Technology | 45 | 67 | +0% | Sales 58% | Mixed | |
| 46 | TransPerfect Connect | 44 | 165 | +389% | Account mgmt 50% | Melbourne, Sydney | Estimate |
| 47 | RELX | 44 | 69 | +179% | Sales 41% | Sydney, Melbourne | Mixed |
| 48 | Uber | 43 | 54 | -7% | Sales 42% | Sydney, Melbourne | Estimate |
| 49 | Arthrex | 42 | 109 | +10% | Sales 64% | Sydney, Melbourne | Careers site |
| 50 | Check Point Software | 42 | 99 | +133% | Sales 48% | Melbourne, Sydney | Careers site |
| 51 | Motion Asia Pacific | 42 | 74 | -27% | Sales 60% | Auckland, Christchurch | Estimate |
| 52 | Metcash | 41 | 141 | -17% | Sales 37% | Sydney, Melbourne | Careers site |
| 53 | Vocus | 41 | 89 | -24% | Sales 34% | Sydney, Melbourne | Careers site |
| 54 | Arrotex Pharmaceuticals | 41 | 79 | +30% | Sales 61% | Sydney, Melbourne | Estimate |
| 55 | Accent Group Careers | 41 | 60 | +4% | Marketing 44% | Melbourne, Sydney | Careers site |
| 56 | LexisNexis | 41 | 55 | +7% | Sales 39% | Sydney, Melbourne | Estimate |
| 57 | Rexel | 40 | 85 | -21% | Sales 83% | Melbourne, Adelaide | Careers site |
| 58 | Stan | 40 | 42 | +15% | Sales 35% | Sydney, Melbourne | Careers site |
| 59 | Thryv | 39 | 93 | -17% | Sales 64% | Regional NSW, Regional VIC | Estimate |
| 60 | Nestlé | 39 | 71 | -11% | Sales 59% | Concord West, Auckland | Careers site |
| 61 | Domain | 39 | 61 | +24% | Marketing 26% | Sydney, Adelaide | Estimate |
| 62 | ServiceNow | 38 | 89 | +9% | Presales 34% | Sydney, Melbourne | Careers site |
| 63 | PFD Food Services | 38 | 83 | +41% | Sales 71% | Melbourne, Brisbane | Estimate |
| 64 | Palo Alto Networks | 38 | 81 | +61% | Presales 37% | Melbourne, Sydney | Careers site |
| 65 | Qantas | 38 | 70 | +88% | Marketing 66% | Sydney, Adelaide | Careers site |
| 66 | Colliers | 38 | 63 | -1% | Sales 58% | Sydney, Perth | Careers site |
| 67 | dentsu | 38 | 60 | +2% | Account mgmt 47% | Sydney, Melbourne | Careers site |
| 68 | Strikeforce AMC | 38 | 59 | +78% | Sales 87% | Sydney, Melbourne | Estimate |
| 69 | WPP Media | 37 | 62 | -41% | Marketing 89% | Sydney, Melbourne | Careers site |
| 70 | Optus | 37 | 48 | -46% | Sales 65% | Sydney, Melbourne | Estimate |
| 71 | Nearmap | 36 | 137 | +300% | Marketing 39% | Sydney, Melbourne | Careers site |
| 72 | Medtronic | 36 | 87 | +10% | Sales 61% | Sydney, Melbourne | Careers site |
| 73 | SoftwareONE | 36 | 53 | +129% | Sales 33% | Melbourne, Sydney | Estimate |
| 74 | Havas Group | 36 | 43 | +10% | Marketing 47% | Sydney, Melbourne | Careers site |
| 75 | Mars | 35 | 73 | +24% | Marketing 40% | Melbourne, Auckland | Careers site |
| 76 | Bunzl Australasia | 35 | 63 | -43% | Account mgmt 54% | Adelaide, Auckland | Mixed |
| 77 | PepsiCo | 35 | 57 | -8% | Sales 46% | Sydney, Melbourne | Careers site |
| 78 | NSW Government departments | 35 | 45 | -8% | Marketing 83% | Mixed | |
| 79 | REA Group | 34 | 102 | +89% | Marketing 29% | Melbourne, Sydney | Careers site |
| 80 | Resonate CX | 34 | 97 | +44% | Sales 74% | Sydney | Estimate |
| 81 | Square (Block) | 34 | 66 | -18% | Sales 56% | Careers site | |
| 82 | Marriott | 34 | 45 | -16% | Sales 62% | Sydney, Adelaide | Careers site |
| 83 | Creative Activation | 33 | 60 | -32% | Sales 61% | Sydney, Melbourne | Careers site |
| 84 | Fever | 33 | 58 | -33% | Sales 33% | Melbourne, Sydney | Careers site |
| 85 | Bidfood Australia | 33 | 53 | +40% | Sales 82% | Melbourne, Sydney | Estimate |
| 86 | Red Bull | 33 | 47 | +1% | Marketing 58% | Sydney, Adelaide | Careers site |
| 87 | Geely Auto Australia | 33 | 45 | +226% | Sales 42% | Sydney, Melbourne | Estimate |
| 88 | Mastercard | 32 | 67 | +29% | Sales 25% | St Leonards, Auckland | Careers site |
| 89 | American Express | 32 | 62 | +119% | Sales 44% | Sydney, Auckland | Careers site |
| 90 | PPG Industries | 32 | 60 | +78% | Sales 44% | Melbourne, Perth | Careers site |
| 91 | Arnott's | 32 | 47 | +29% | Sales 59% | Sydney, Auckland | Estimate |
| 92 | TikTok | 32 | 44 | +42% | Marketing 50% | Sydney | Estimate |
| 93 | Stripe | 31 | 67 | -31% | Sales 58% | Melbourne, Sydney | Mixed |
| 94 | Spark Foundry Australia | 31 | 50 | +2% | Marketing 65% | Sydney, Melbourne | Estimate |
| 95 | Techtronic Industries | 31 | 46 | -5% | Sales 71% | Melbourne, Brisbane | Estimate |
| 96 | GitLab | 31 | 37 | -11% | Sales 48% | Singapore, Sydney | Mixed |
| 97 | GE HealthCare | 30 | 58 | +3% | Sales 43% | Sydney, Brisbane | Careers site |
| 98 | Travel + Leisure Co | 29 | 57 | +29% | Sales 76% | Gold Coast, Melbourne | Careers site |
| 99 | DKSH | 29 | 54 | +17% | Sales 76% | Auckland, Sydney | Careers site |
| 100 | Easygo | 29 | 47 | -5% | Marketing 52% | Melbourne | Careers site |
What the table does not say
Four of the top 20 are banks. ANZ, Commonwealth Bank, Westpac and NAB posted 463 unique GTM ads this quarter against 317 last quarter, up 46%. ANZ on its own posted more than Microsoft, Google or Salesforce. The titles are small business specialist, business banking manager, relationship manager, agribusiness executive: the banks are adding SME coverage roles across Sydney, Melbourne and Brisbane. If you sell into SMEs, that is who you are competing with for account managers this quarter, and you will not learn their price from the ads: one of the four banks' 858 ads printed a salary.

Amazon is first by a distance and nearly nine in ten of its ads mention AWS: 334 unique ads from 653 posted, up 45%. AI sales specialist, public sector account executive, national security business development, solutions architect. Many of its ads go into several cities at once, which is why the raw count is nearly double the unique one.
The US software names are mostly down. Salesforce fell from 110 unique ads to 82 even after we folded MuleSoft and the Informatica-branded ads into its count. SAP went from 61 to 19, Databricks from 52 to 29, Stripe from 45 to 31. Microsoft and Google are up around 20 to 25%, and Cisco, Palo Alto and Check Point are up more than that. Most of the falls are in application software. The security and cloud names are mostly up, with CrowdStrike and Hewlett Packard Enterprise the exceptions.
Telstra, Optus and Vocus together went from 210 unique ads to 131, down 38%. Datacom fell 57%. Going the other way, CoStar went from 53 to 100, with "sales executive, residential" its most-posted title, and Bayer from 11 to 52 with 25 unique ads for one title, customer engagement partner. carsales, Nine, TMGM, RELX, Check Point, Nearmap, SoftwareONE, Geely and American Express also at least doubled. Across the 100, 53 grew their unique ads by more than 10% and 20 shrank by more than 10%.
September's openers
The employers that posted the most unique GTM ads between 1 and 27 September, same method. 7,409 direct employers posted 18,295 ads, 13,857 of them unique.
| # | Employer | Unique ads | Total ads |
|---|---|---|---|
| 1 | Amazon (incl. AWS) | 65 | 125 |
| 2 | ANZ | 51 | 88 |
| 3 | Microsoft | 47 | 77 |
| 4 | Flight Centre | 43 | 71 |
| 5 | 39 | 104 | |
| 6 | Westpac | 39 | 61 |
| 7 | Publicis Groupe | 33 | 37 |
| 8 | Asahi Beverages | 31 | 53 |
| 9 | Bapcor | 30 | 64 |
| 10 | Cotton On Group | 30 | 43 |
| 11 | CoStar | 30 | 37 |
| 12 | Genuine Parts (Repco) | 29 | 29 |
| 13 | Salesforce | 28 | 104 |
| 14 | Johnson & Johnson | 28 | 67 |
| 15 | Xero | 27 | 51 |
Google and Salesforce both posted 104 ads in the month; Google's were 39 unique, Salesforce's 28, and Salesforce's most-posted ad was a "talent community" invitation rather than a job. ANZ posted more unique ads in the month than any software vendor, Microsoft included.
What changed inside the titles, tech first
The tech sector moved the opposite way to the market. Employers our data flags as tech posted 10,346 unique GTM ads, down 4% on the prior quarter, while the market rose 5%. Inside tech, demand concentrated: the 89 flagged employers that sit in the tech 100 posted 2,882 unique ads, up 12%, and the other 2,561 tech employers posted 7,464, down 9%.
The titles show where the cuts fell. Among tech employers, senior account executive ads fell 63% (43 to 16), enterprise account executive 39% (59 to 36), senior customer success manager 53% (36 to 17), partner manager 45%, customer success manager 24% and SDR 16%. Business development manager, still the most posted tech title, fell 18%. The titles that grew are solutions engineer and architect (91 to 104), marketing manager (28 to 43) and marketing coordinator (28 to 40).
By function, tech sales ads fell 10% and account management 11%, while customer success rose 10% and partnerships 13%. In the tech 100, customer success ads rose 23%, partnerships 28% and RevOps 24%, and sales ads rose 4%. The largest tech hirers posted more customer success and partner ads; the rest of the sector posted fewer sales ads.

Across the whole market the pattern from the winter issues held. Business development representative ads are up 22% on the prior quarter, internal sales 27%, marketing coordinator 22% and marketing manager 18%. Business development manager, the most posted GTM title at 1,558 unique ads, is up 9%. Enterprise account executive ads fell 29%, senior account executive 38%, senior customer success manager 40%, key account manager 16% and sales manager 13%. Put the two AE titles together and there are about a third fewer of them than in the prior quarter.
Pay did not move on the quarter. Median advertised base midpoint is $100,000 across 8,639 unique ads that disclosed a salary range, the same as last quarter. By function the medians run from $140,000 in presales and $116,000 in partnerships down to $97,500 in RevOps and $95,000 in marketing, with sales, account management and customer success at $100,000.
The numbers this week
The active ANZ pool closed at 5,371 GTM roles, down 1,040 on the week, with 4,636 opened and 5,853 closed. That is the largest weekly fall since June, and most of it is the two weeks before it unwinding: closures in the weeks ending 13 and 20 September were the second and third lowest in the series, which runs from June, and that lifted the pool 15.6% in a week, and this week's closures were a median week for the series. Openings stayed inside the band they have held since April. Three weeks ago the pool was 5,779, so the drop over the month is 7%.
Median advertised base $100,000 on 765 disclosing ads, quartiles $82,500 to $126,537, transparency 15.0%. Sales is 2,197 of the active pool, marketing 1,414, account management 702.
Singapore's pool closed at 1,153 tracked GTM roles, 941 opened, 728 closed.
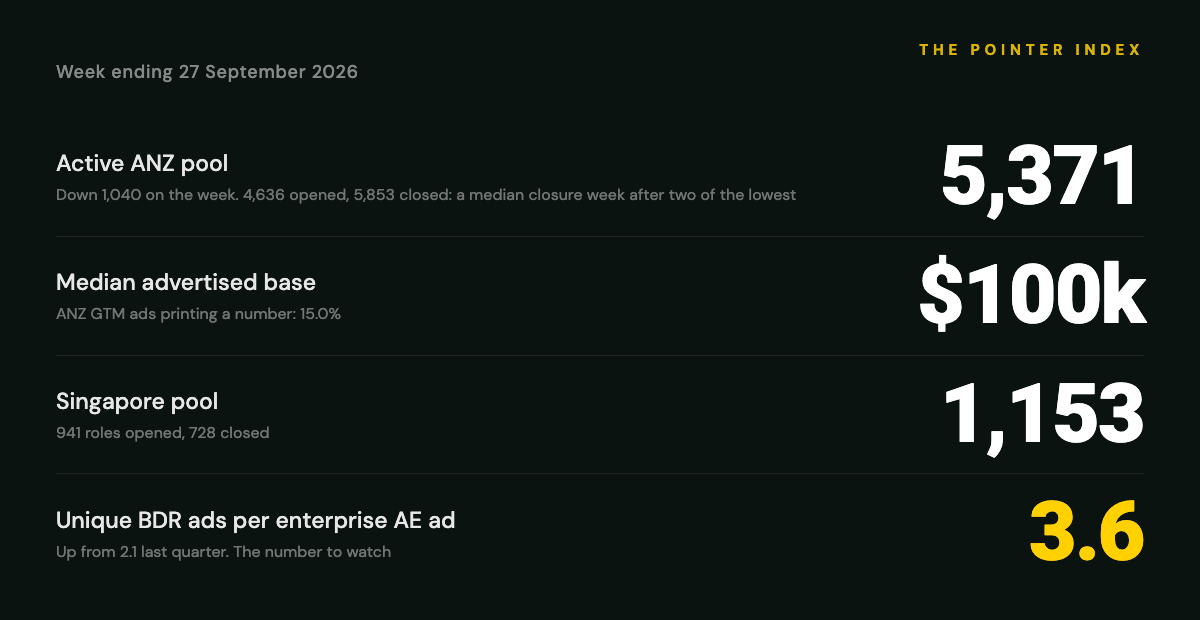
The number to watch is 3.6, unique BDR ads for every unique enterprise AE ad across the market, up from 2.1 last quarter. Among tech employers it is 2.1, up from 1.4.
Ricky Pearl, Pointer Strategy
pointerstrategy.com/market-data
<small>
*Methodology.* "GTM" means Sales, Account Management, Marketing, Customer Success, Presales, RevOps, Enablement, Partnerships, Growth, Product Marketing and GTM Engineering. Source is every direct-employer job listing in Australia and New Zealand first seen between 25 June and 22 September 2026 on LinkedIn, Seek and employer careers sites. Recruitment agency listings are excluded throughout, and so are companies that advertise on behalf of clients, including Pointer's own ads. The prior quarter is 6 April to 24 June, 80 days, scaled to a 90-day rate for every comparison; the week before 6 April is excluded because it contains the initial load of everything already live. September's openers use the same method on ads first seen 1 to 27 September.
*Unique ads.* The same ad is routinely posted five or more times: once per city on LinkedIn, again on Seek, again on the careers site. A raw ad count mostly measures how many times an employer chose to post. Our unique count works title by title within each employer. Where the employer's own careers site is in our feed, we count distinct requisition links there and treat board postings for the same title as copies ("Careers site" in the Basis column; 61 of the 100). Where it is not, we count distinct posting weeks per title, so twelve city variants of one ad in one week count once, and the same title reappearing three weeks later counts again ("Estimate"; 26 of the 100). "Mixed" means the careers site covers some of the employer's titles but not all. Genuine multi-hires survive this: carsales' 11 customer success manager ads over eight weeks count as 11. An employer that re-posts the same title every week is counted once per week, since a seat advertised all quarter is one the employer keeps needing to fill. A unique ad is not a headcount. One ad may be filling several seats, and we make no claim about how many.
*Company names.* Employers are merged where the same organisation posts under more than one name (ANZ and ANZ Banking Group; Westpac and Westpac Group; Amazon and AWS; Salesforce, MuleSoft and Informatica-branded Salesforce ads; Publicis and its holding entity; Cotton On and its Geelong support-centre page; DXC, Nearmap, Domain, SEEK, Fujitsu, Experian and Oracle with their Australian-entity pages). Gallagher's insurance broking and animal-technology businesses share one name in our data and are shown together in the overall table and left out of the tech table.
*The tech list.* Membership was decided by hand from each employer's industry, using the definition given in the section. The 22.6% sector figure uses the tech flag in our company data, which does not match the hand-checked list exactly, so the two are different populations. Headquarters come from LinkedIn company profiles. One employer, NRI ANZ, was removed because its ads could not be verified as its own. Where two names for one employer could not be fully reconciled we show the lower count.
*What this cannot tell you.* We do not see headcount, attrition or tenure, and we make no claim about them. Seniority mix is not compared across quarters because the seniority classifier changed on 8 June. Retail floor sales titles left the GTM classification during the prior quarter, so retailers such as Nick Scali and JB Hi-Fi appear to have collapsed and have been left out of the fallers rather than reported. The "growth" function rose 73% quarter on quarter and part of that is classification drift, which is why it is not in the headline findings. Pay figures are medians of advertised AUD ranges with a $60,000 floor. We report the level; whether pay has moved is assessed only in the quarterly index, where the sample supports it.
*On the weekly figures.* Market-index figures are point-in-time snapshots at the close of the reporting week, recorded in an insert-only weekly index that is never recomputed. The median absolute week-on-week move in the active pool since June 2026 is 4.0%, range 0.3% to 21.2%. Pool readings are like-for-like Sunday snapshots; this week's fall is decomposed above and the source-level detail is available on request. From 25 September our LinkedIn feed moved to a new supplier; the effect on the pool arrives in next week's reading and that week will carry a series note. Singapore is tracked as a separate stats-only region and is never pooled with ANZ. The live dashboard updates continuously and may differ slightly.
*Corrections.* If your company is in the table and a number looks wrong, reply and we will check the underlying ads. Corrections run in the next issue.
</small>