
Issue 08 of The Pointer Index · Week ending 7 June 2026 · Special edition
This week we are doing something different. The index gets five numbers, and the rest of the issue is the full set of role-by-role salary benchmarks, the same numbers that power the salaries pages, in one place. Bookmark it, forward it to whoever runs your comp review.
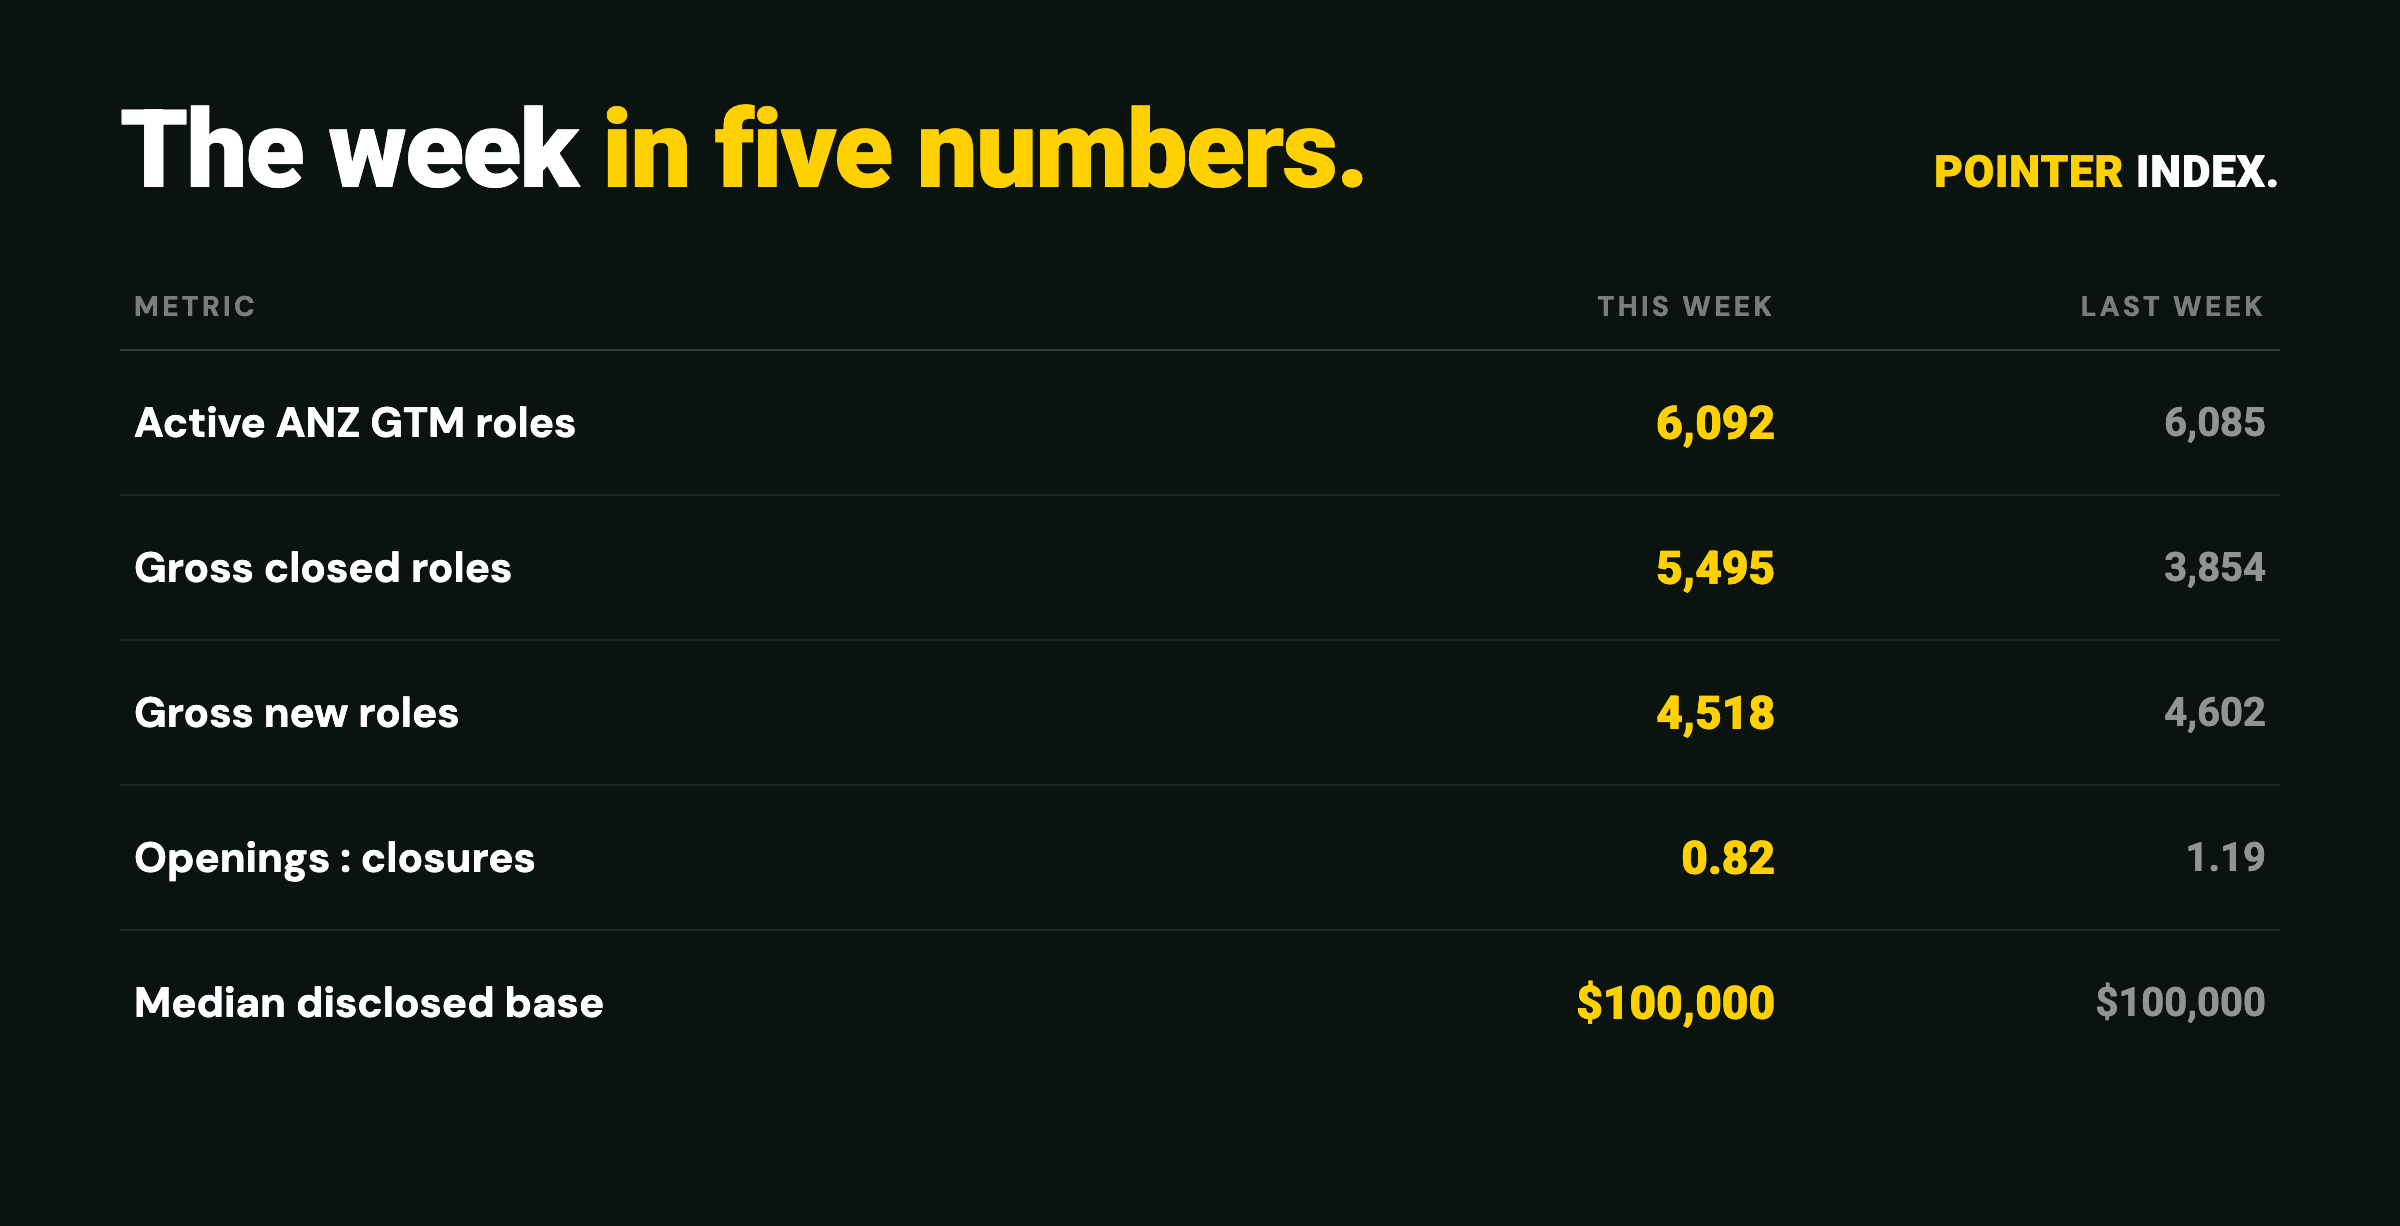
The week in five numbers
How to read the benchmarks
Each role shows a low / mid / high band for base and OTE. These blend four sources: published FY25/26 salary guides, live job listings scraped daily, community submissions, and Pointer placement records. No single source is load-bearing. Full methodology and city-level cuts on the salaries pages.
Sales
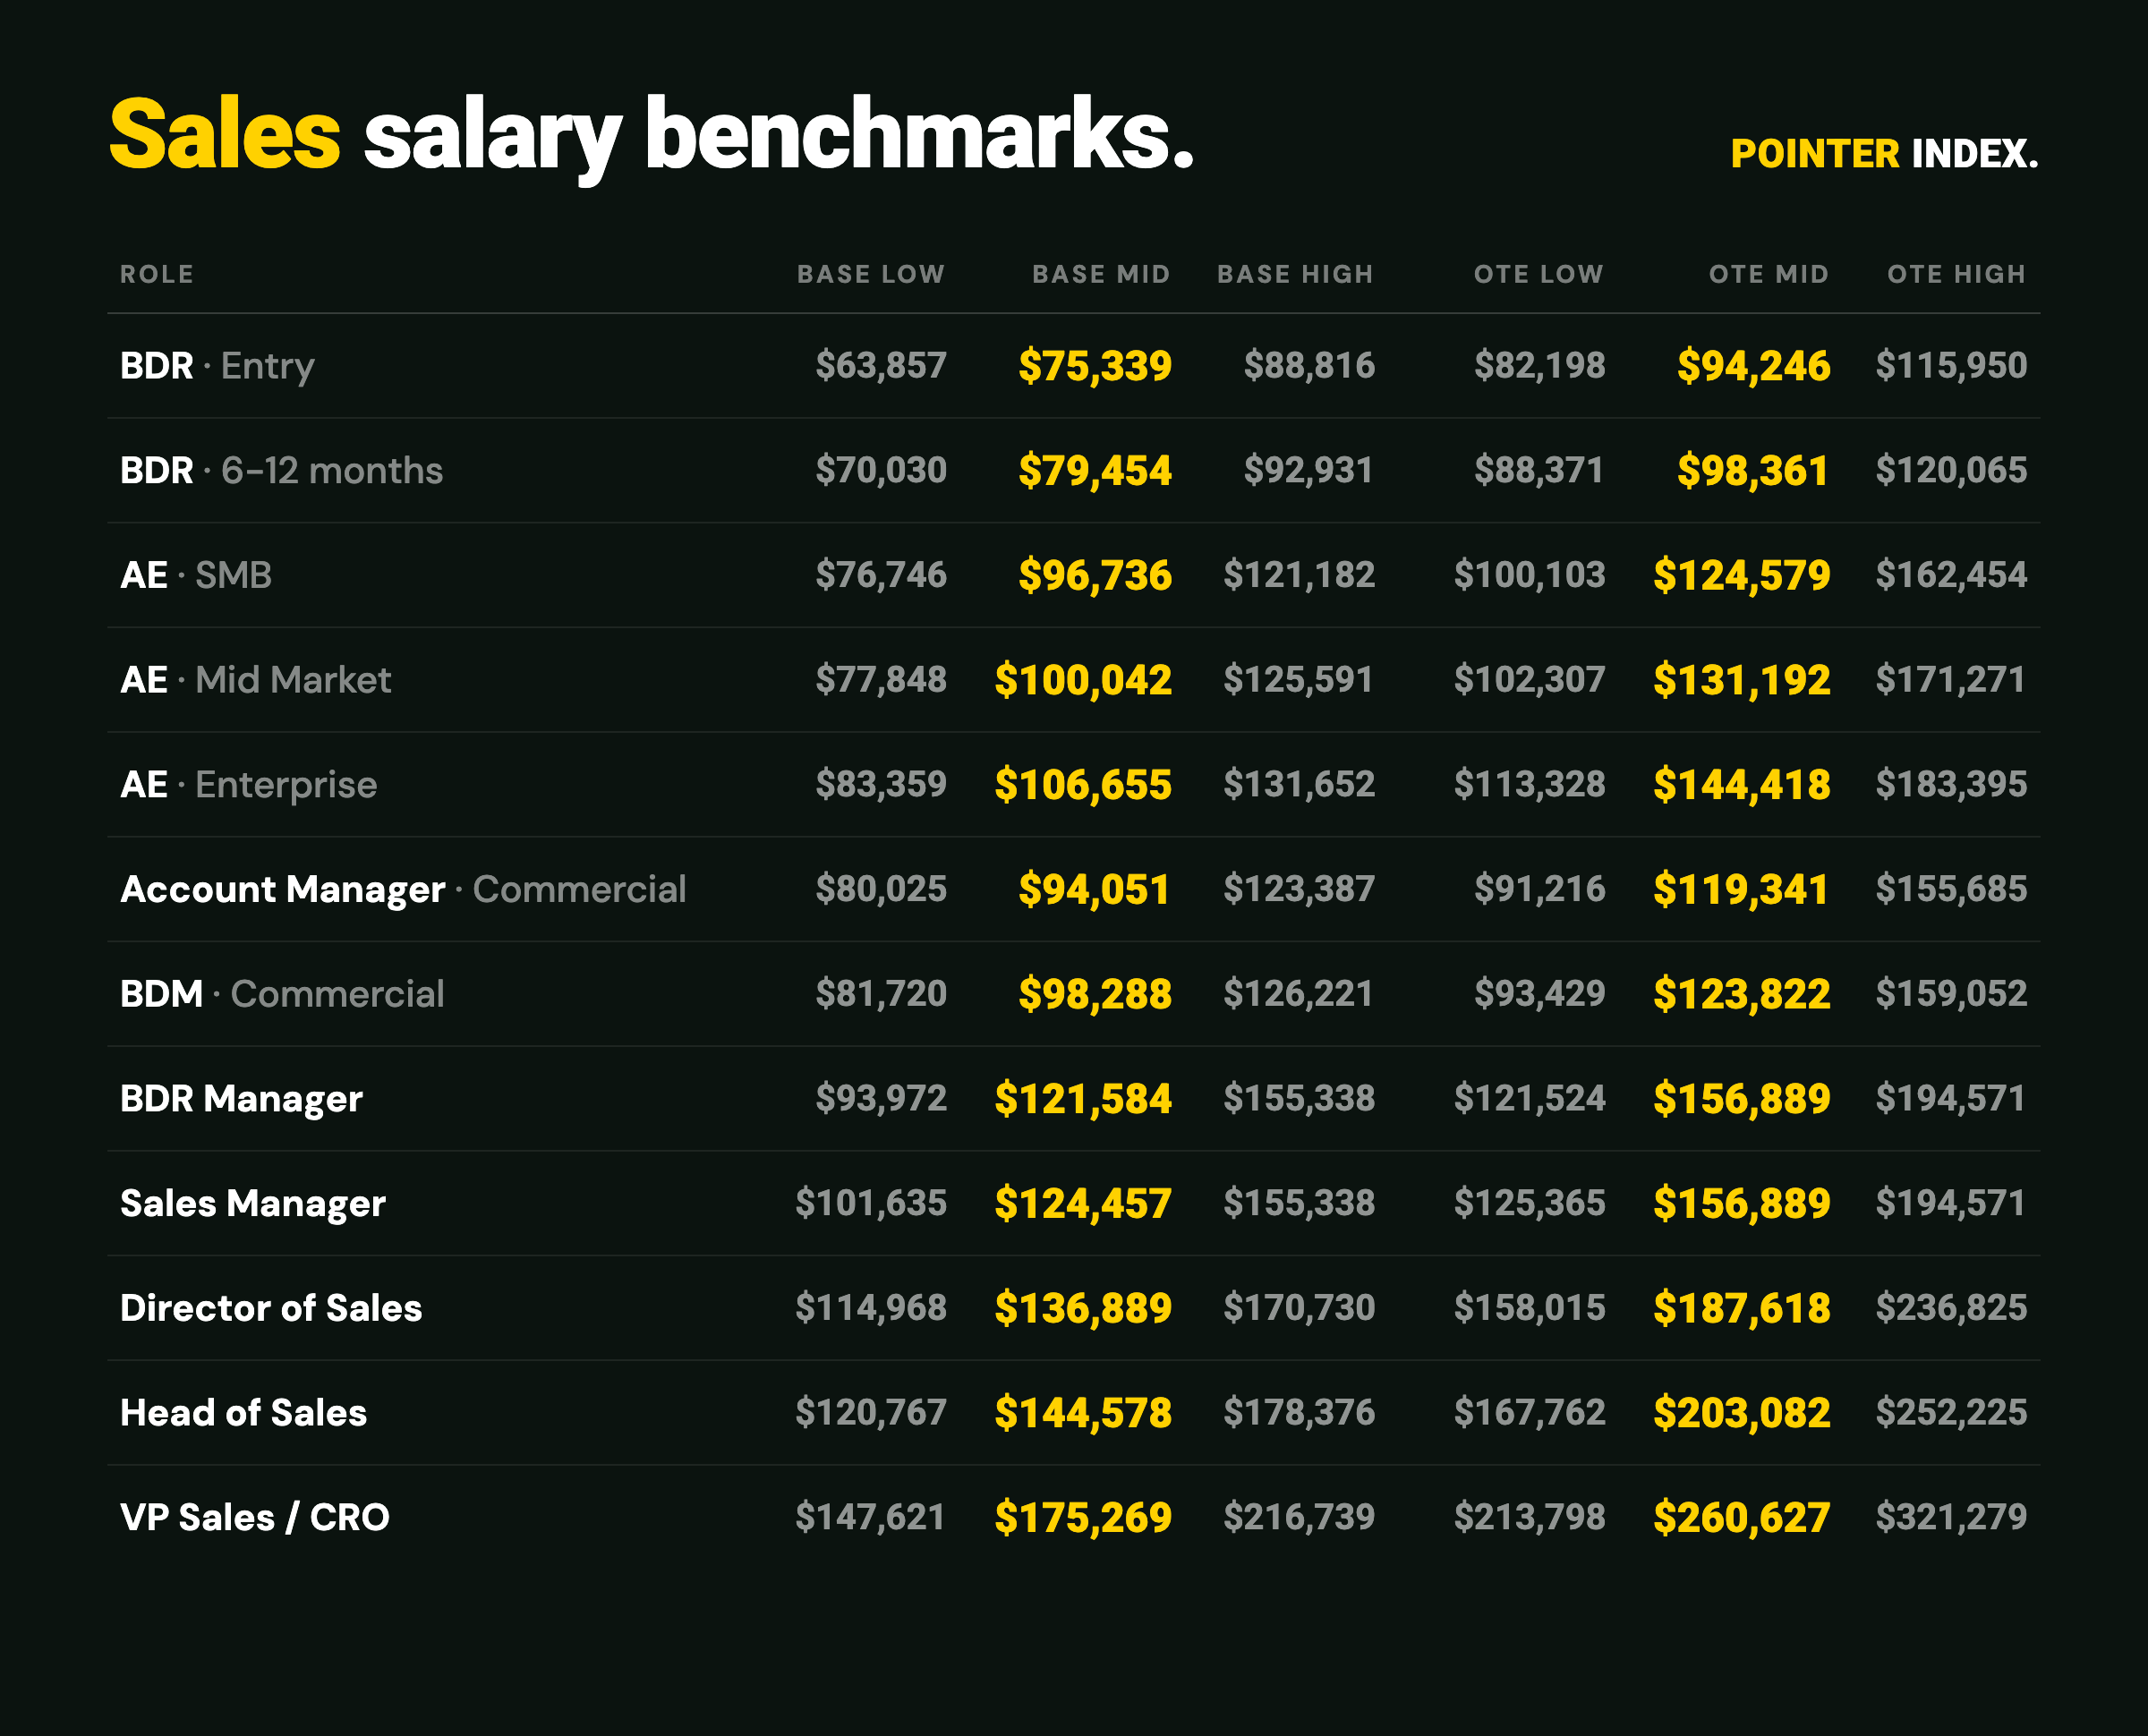
| Role · segment | Base (low / mid / high) | OTE (low / mid / high) |
|---|---|---|
| BDR · Entry | $63,857 / $75,339 / $88,816 | $82,198 / $94,246 / $115,950 |
| BDR · 6-12 months | $70,030 / $79,454 / $92,931 | $88,371 / $98,361 / $120,065 |
| AE · SMB | $76,746 / $96,736 / $121,182 | $100,103 / $124,579 / $162,454 |
| AE · Mid Market | $77,848 / $100,042 / $125,591 | $102,307 / $131,192 / $171,271 |
| AE · Enterprise | $83,359 / $106,655 / $131,652 | $113,328 / $144,418 / $183,395 |
| Account Manager · Commercial | $80,025 / $94,051 / $123,387 | $91,216 / $119,341 / $155,685 |
| BDM · Commercial | $81,720 / $98,288 / $126,221 | $93,429 / $123,822 / $159,052 |
| BDR Manager | $93,972 / $121,584 / $155,338 | $121,524 / $156,889 / $194,571 |
| Sales Manager | $101,635 / $124,457 / $155,338 | $125,365 / $156,889 / $194,571 |
| Director of Sales | $114,968 / $136,889 / $170,730 | $158,015 / $187,618 / $236,825 |
| Head of Sales | $120,767 / $144,578 / $178,376 | $167,762 / $203,082 / $252,225 |
| VP Sales / CRO | $147,621 / $175,269 / $216,739 | $213,798 / $260,627 / $321,279 |
Full sales benchmarks, including city cuts →
Account Management
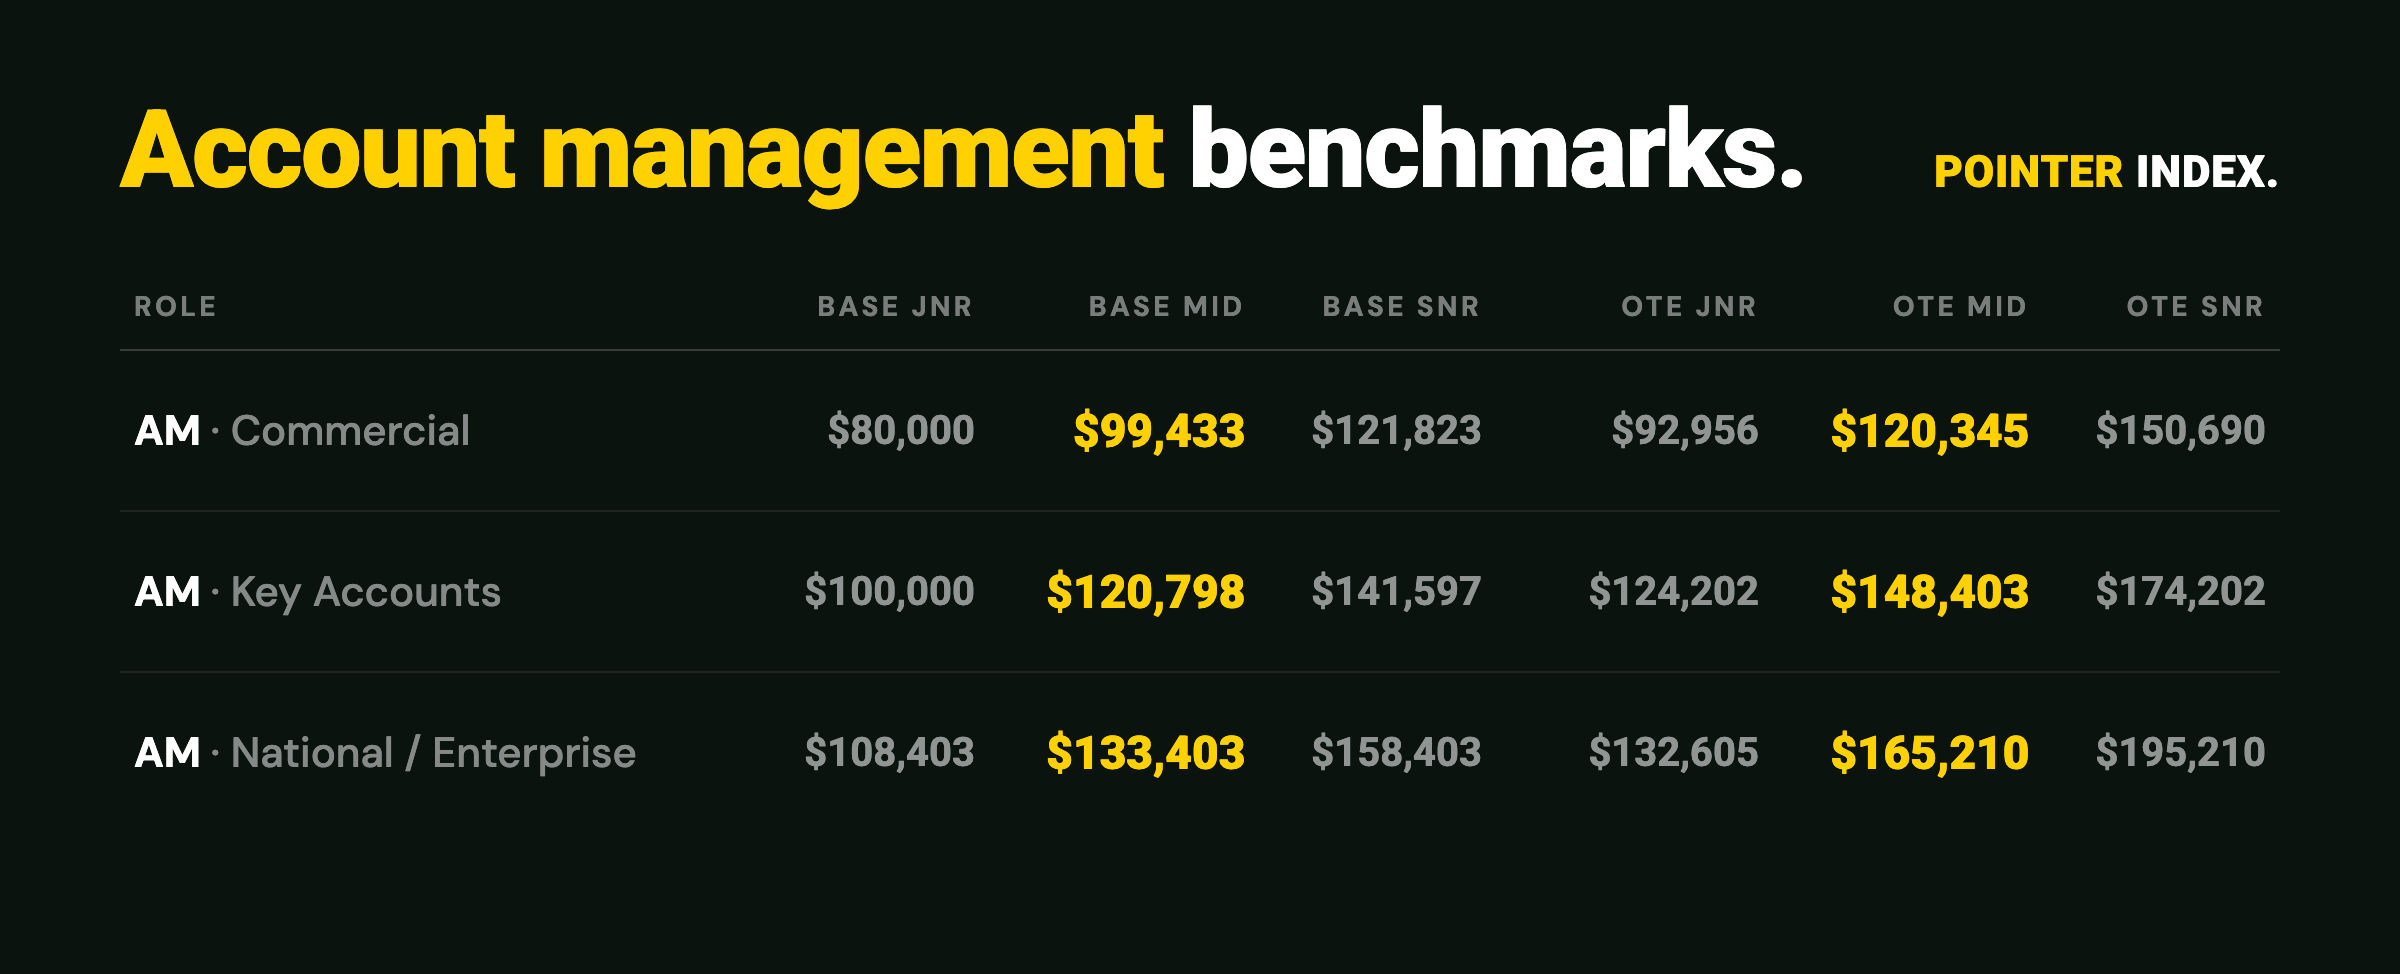
| Role · segment | Base (jnr / mid / snr) | OTE (jnr / mid / snr) |
|---|---|---|
| AM · Commercial | $80,000 / $99,433 / $121,823 | $92,956 / $120,345 / $150,690 |
| AM · Key Accounts | $100,000 / $120,798 / $141,597 | $124,202 / $148,403 / $174,202 |
| AM · National / Enterprise | $108,403 / $133,403 / $158,403 | $132,605 / $165,210 / $195,210 |
Full account management benchmarks →
Marketing
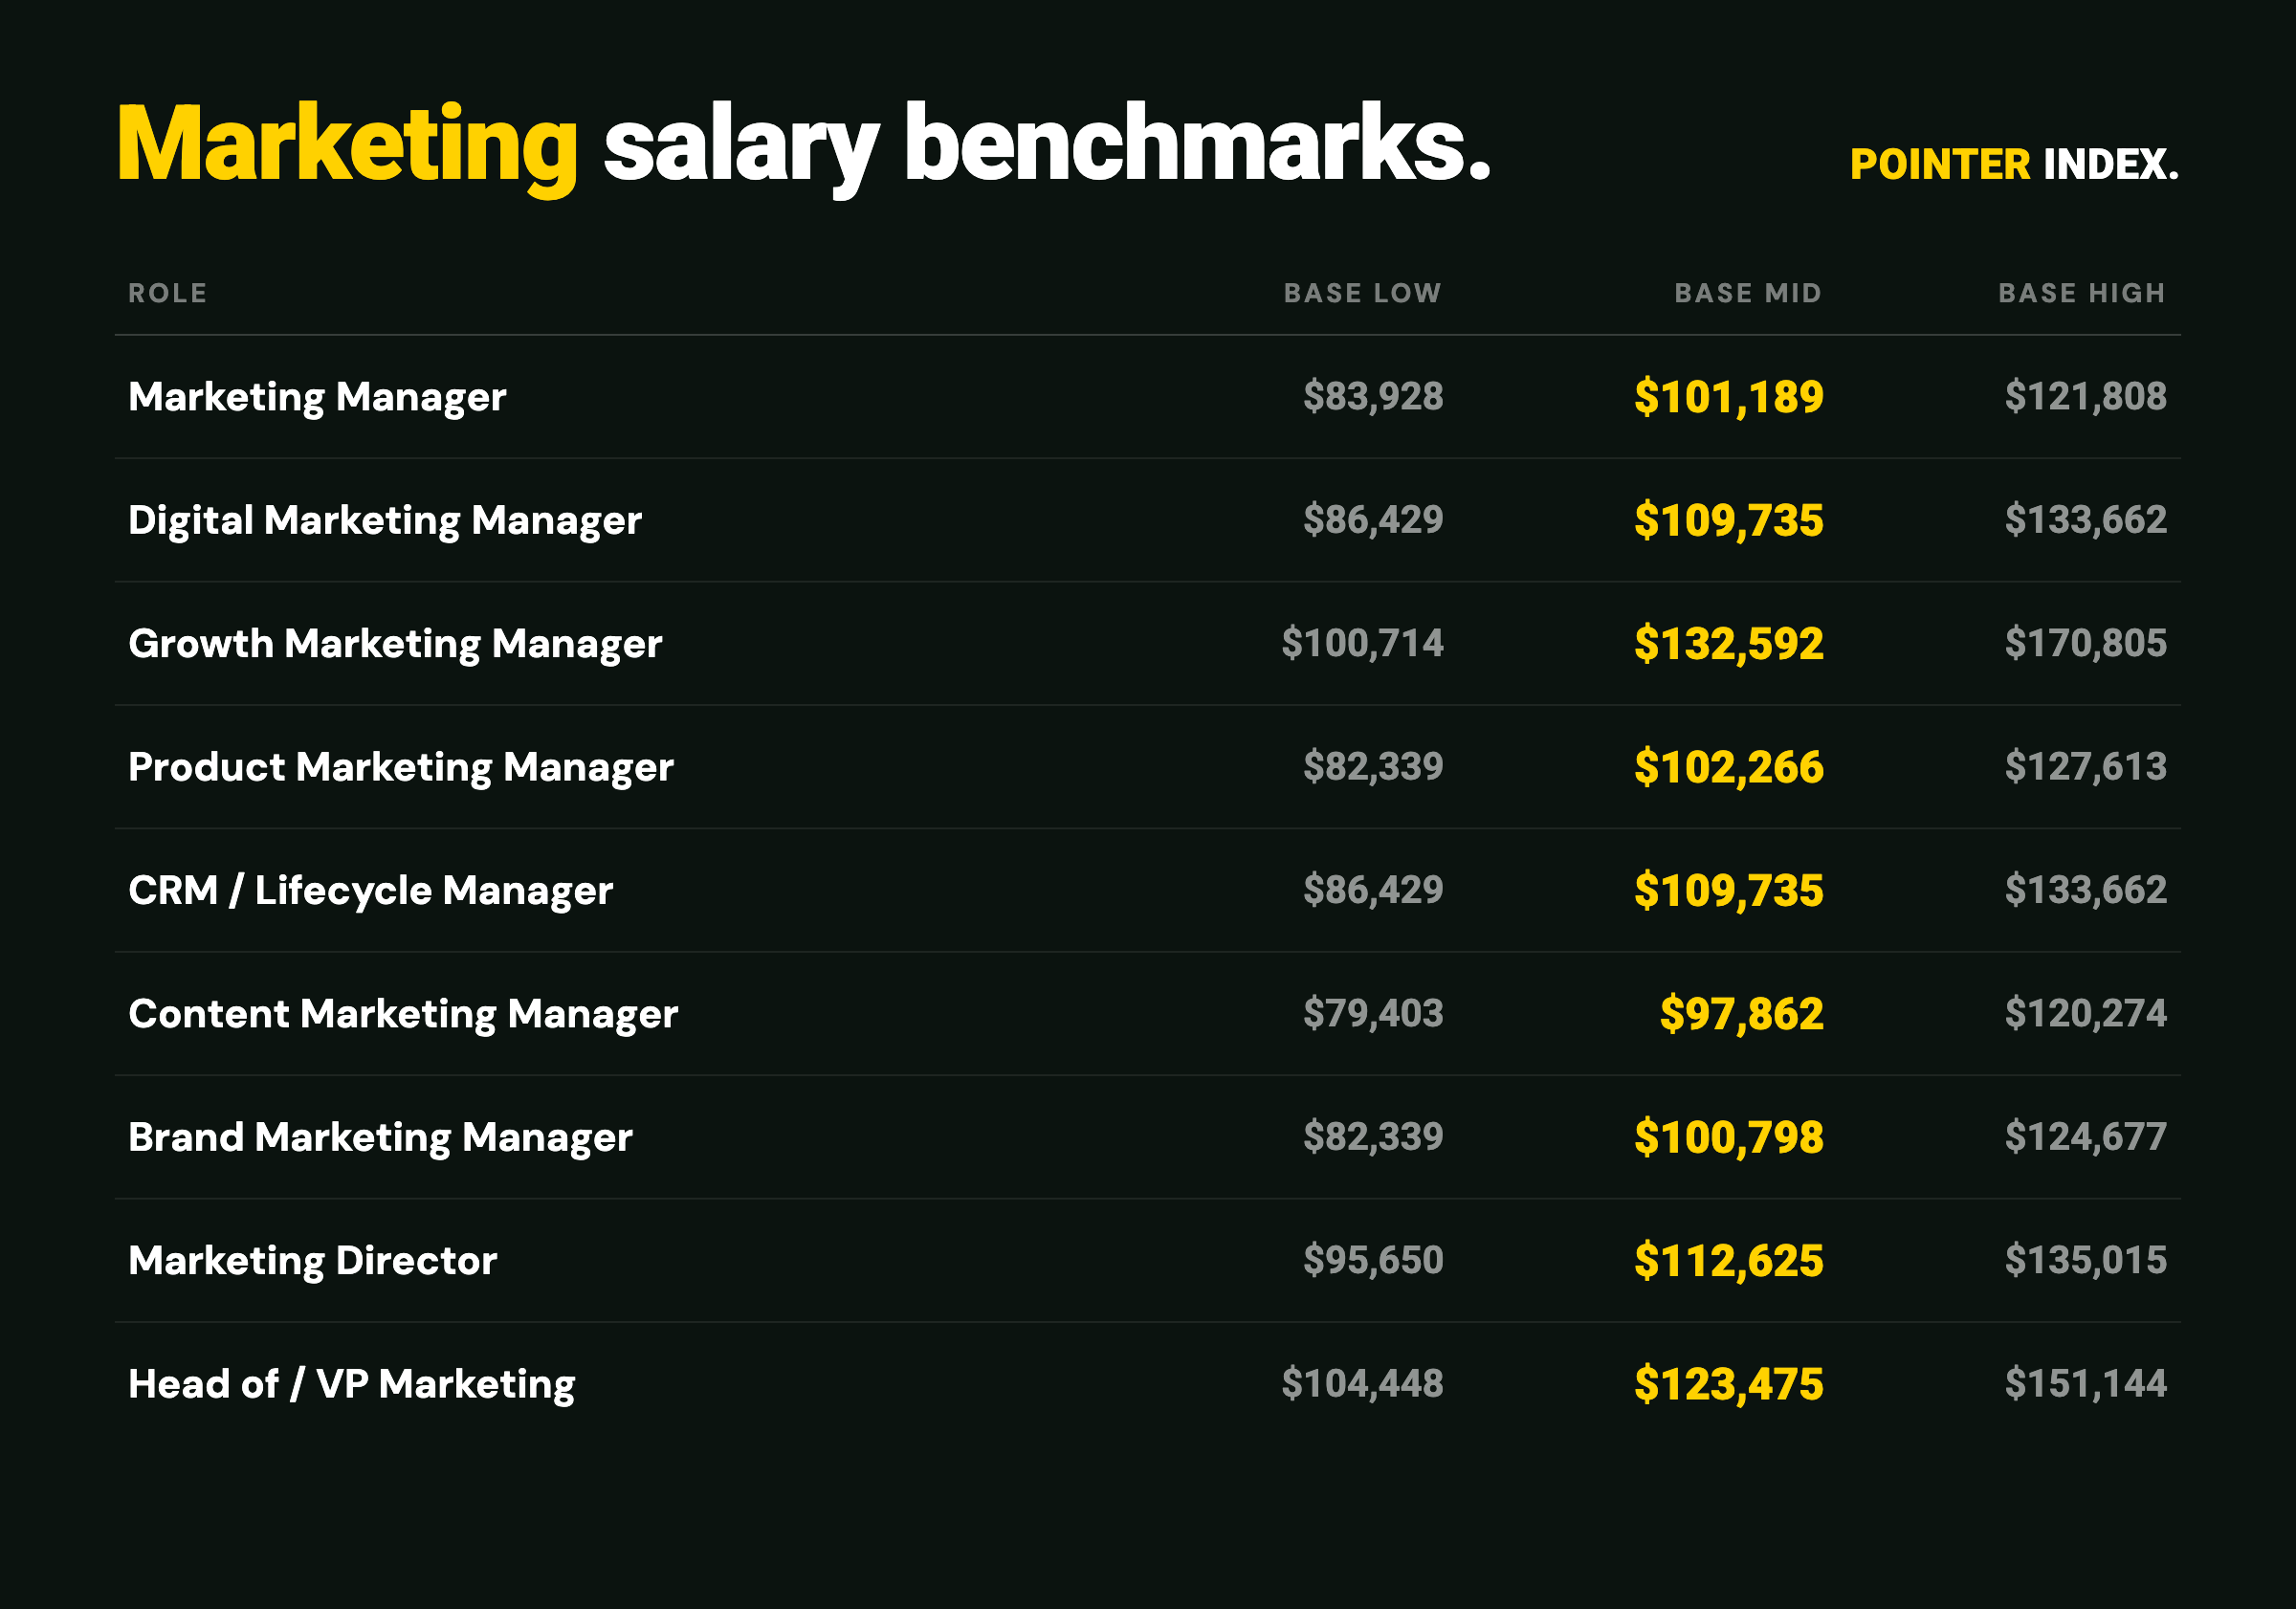
| Role | Base (low / mid / high) |
|---|---|
| Marketing Manager | $83,928 / $101,189 / $121,808 |
| Digital Marketing Manager | $86,429 / $109,735 / $133,662 |
| Growth Marketing Manager | $100,714 / $132,592 / $170,805 |
| Product Marketing Manager | $82,339 / $102,266 / $127,613 |
| CRM / Lifecycle Manager | $86,429 / $109,735 / $133,662 |
| Content Marketing Manager | $79,403 / $97,862 / $120,274 |
| Brand Marketing Manager | $82,339 / $100,798 / $124,677 |
| Marketing Director | $95,650 / $112,625 / $135,015 |
| Head of / VP Marketing | $104,448 / $123,475 / $151,144 |
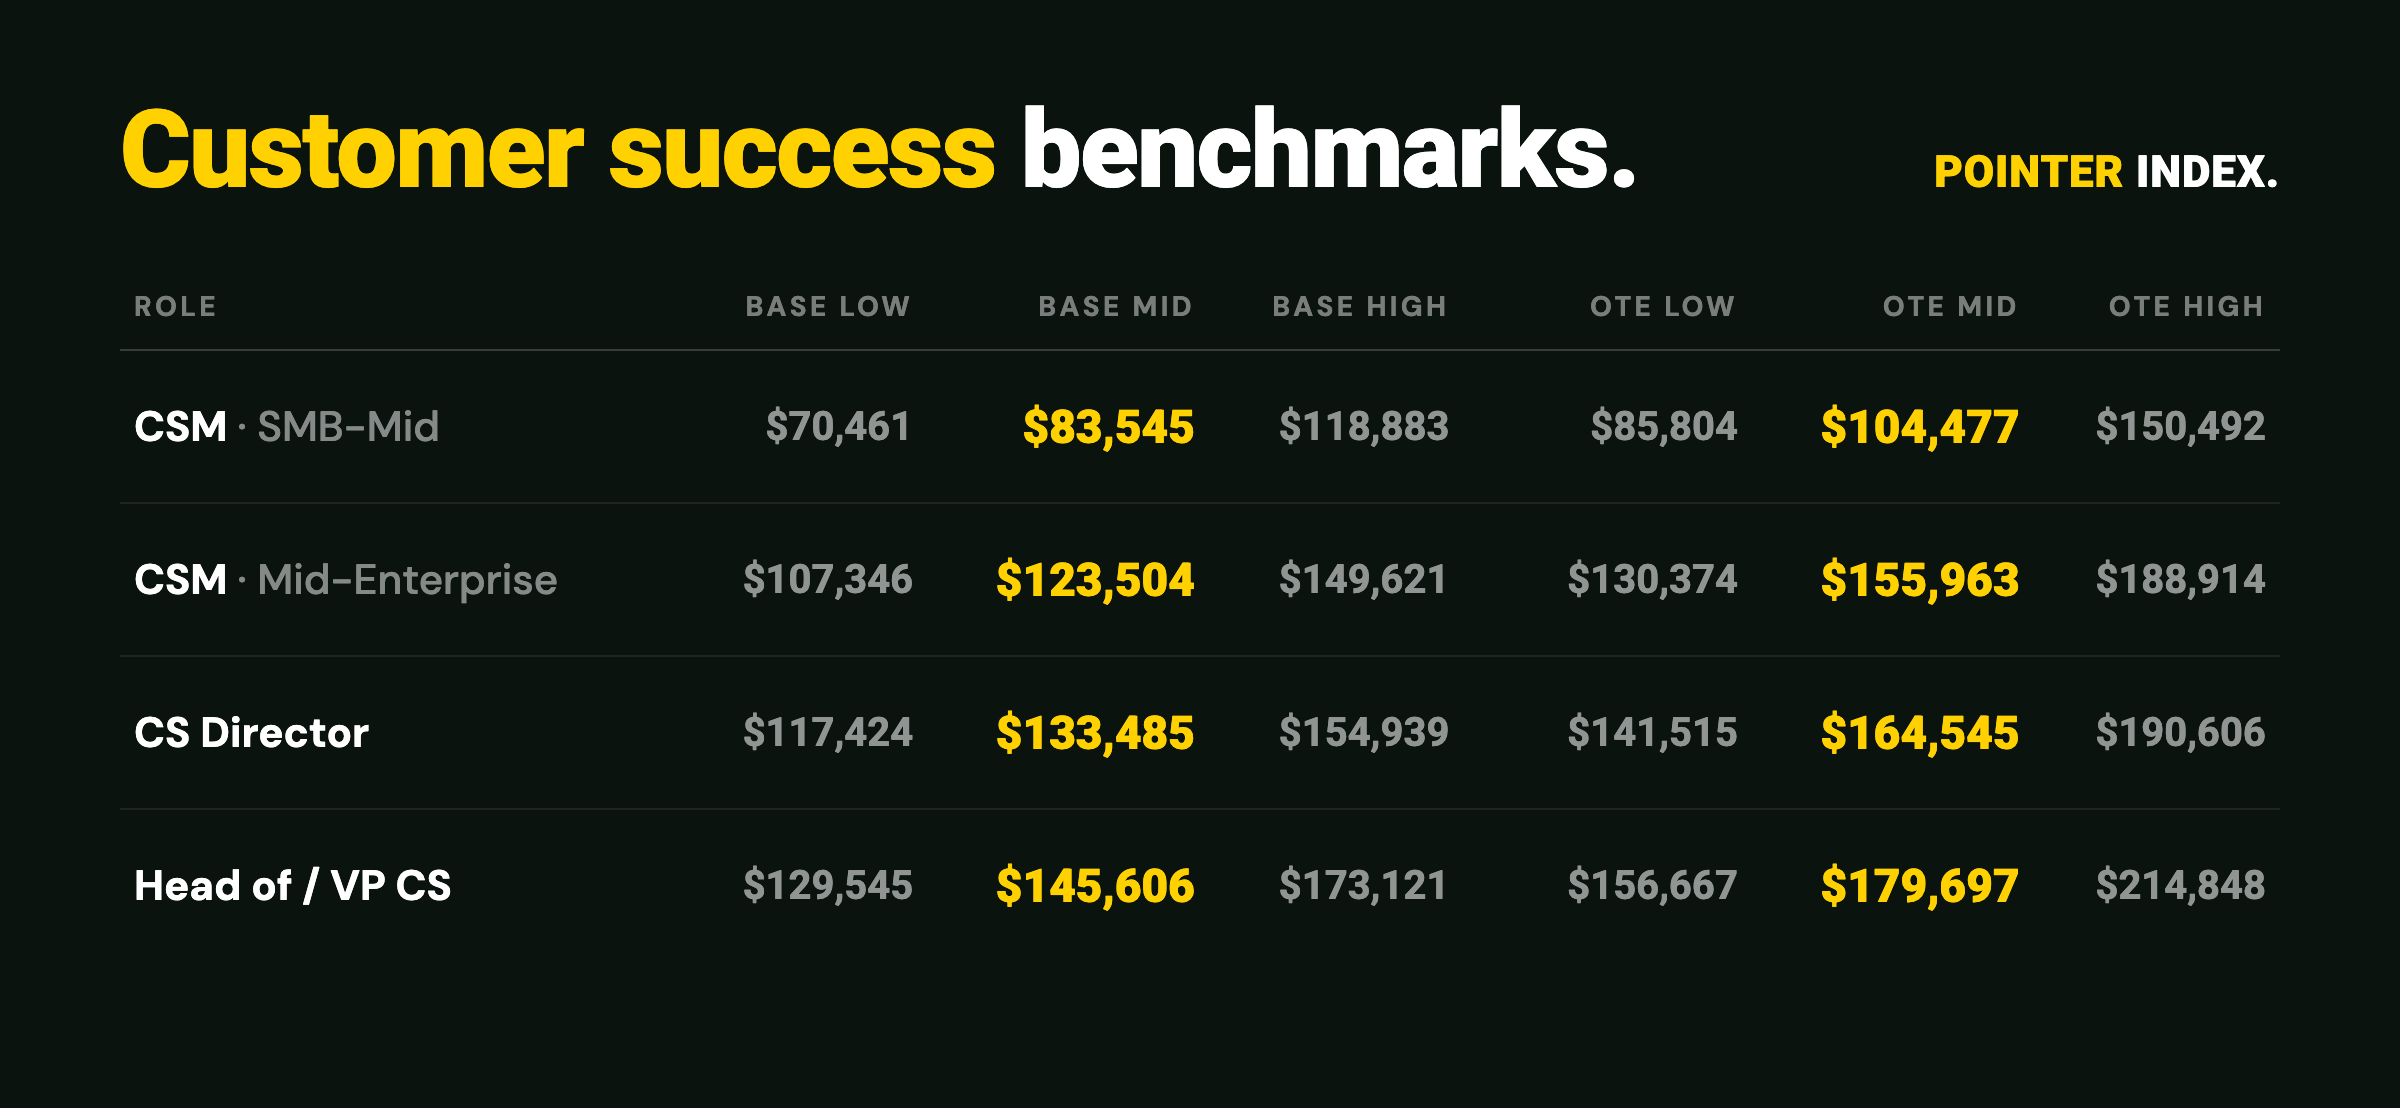
Customer Success
| Role · segment | Base (low / mid / high) | OTE (low / mid / high) |
|---|---|---|
| CSM · SMB-Mid | $70,461 / $83,545 / $118,883 | $85,804 / $104,477 / $150,492 |
| CSM · Mid-Enterprise | $107,346 / $123,504 / $149,621 | $130,374 / $155,963 / $188,914 |
| CS Director | $117,424 / $133,485 / $154,939 | $141,515 / $164,545 / $190,606 |
| Head of / VP CS | $129,545 / $145,606 / $173,121 | $156,667 / $179,697 / $214,848 |
Full customer success benchmarks →
RevOps
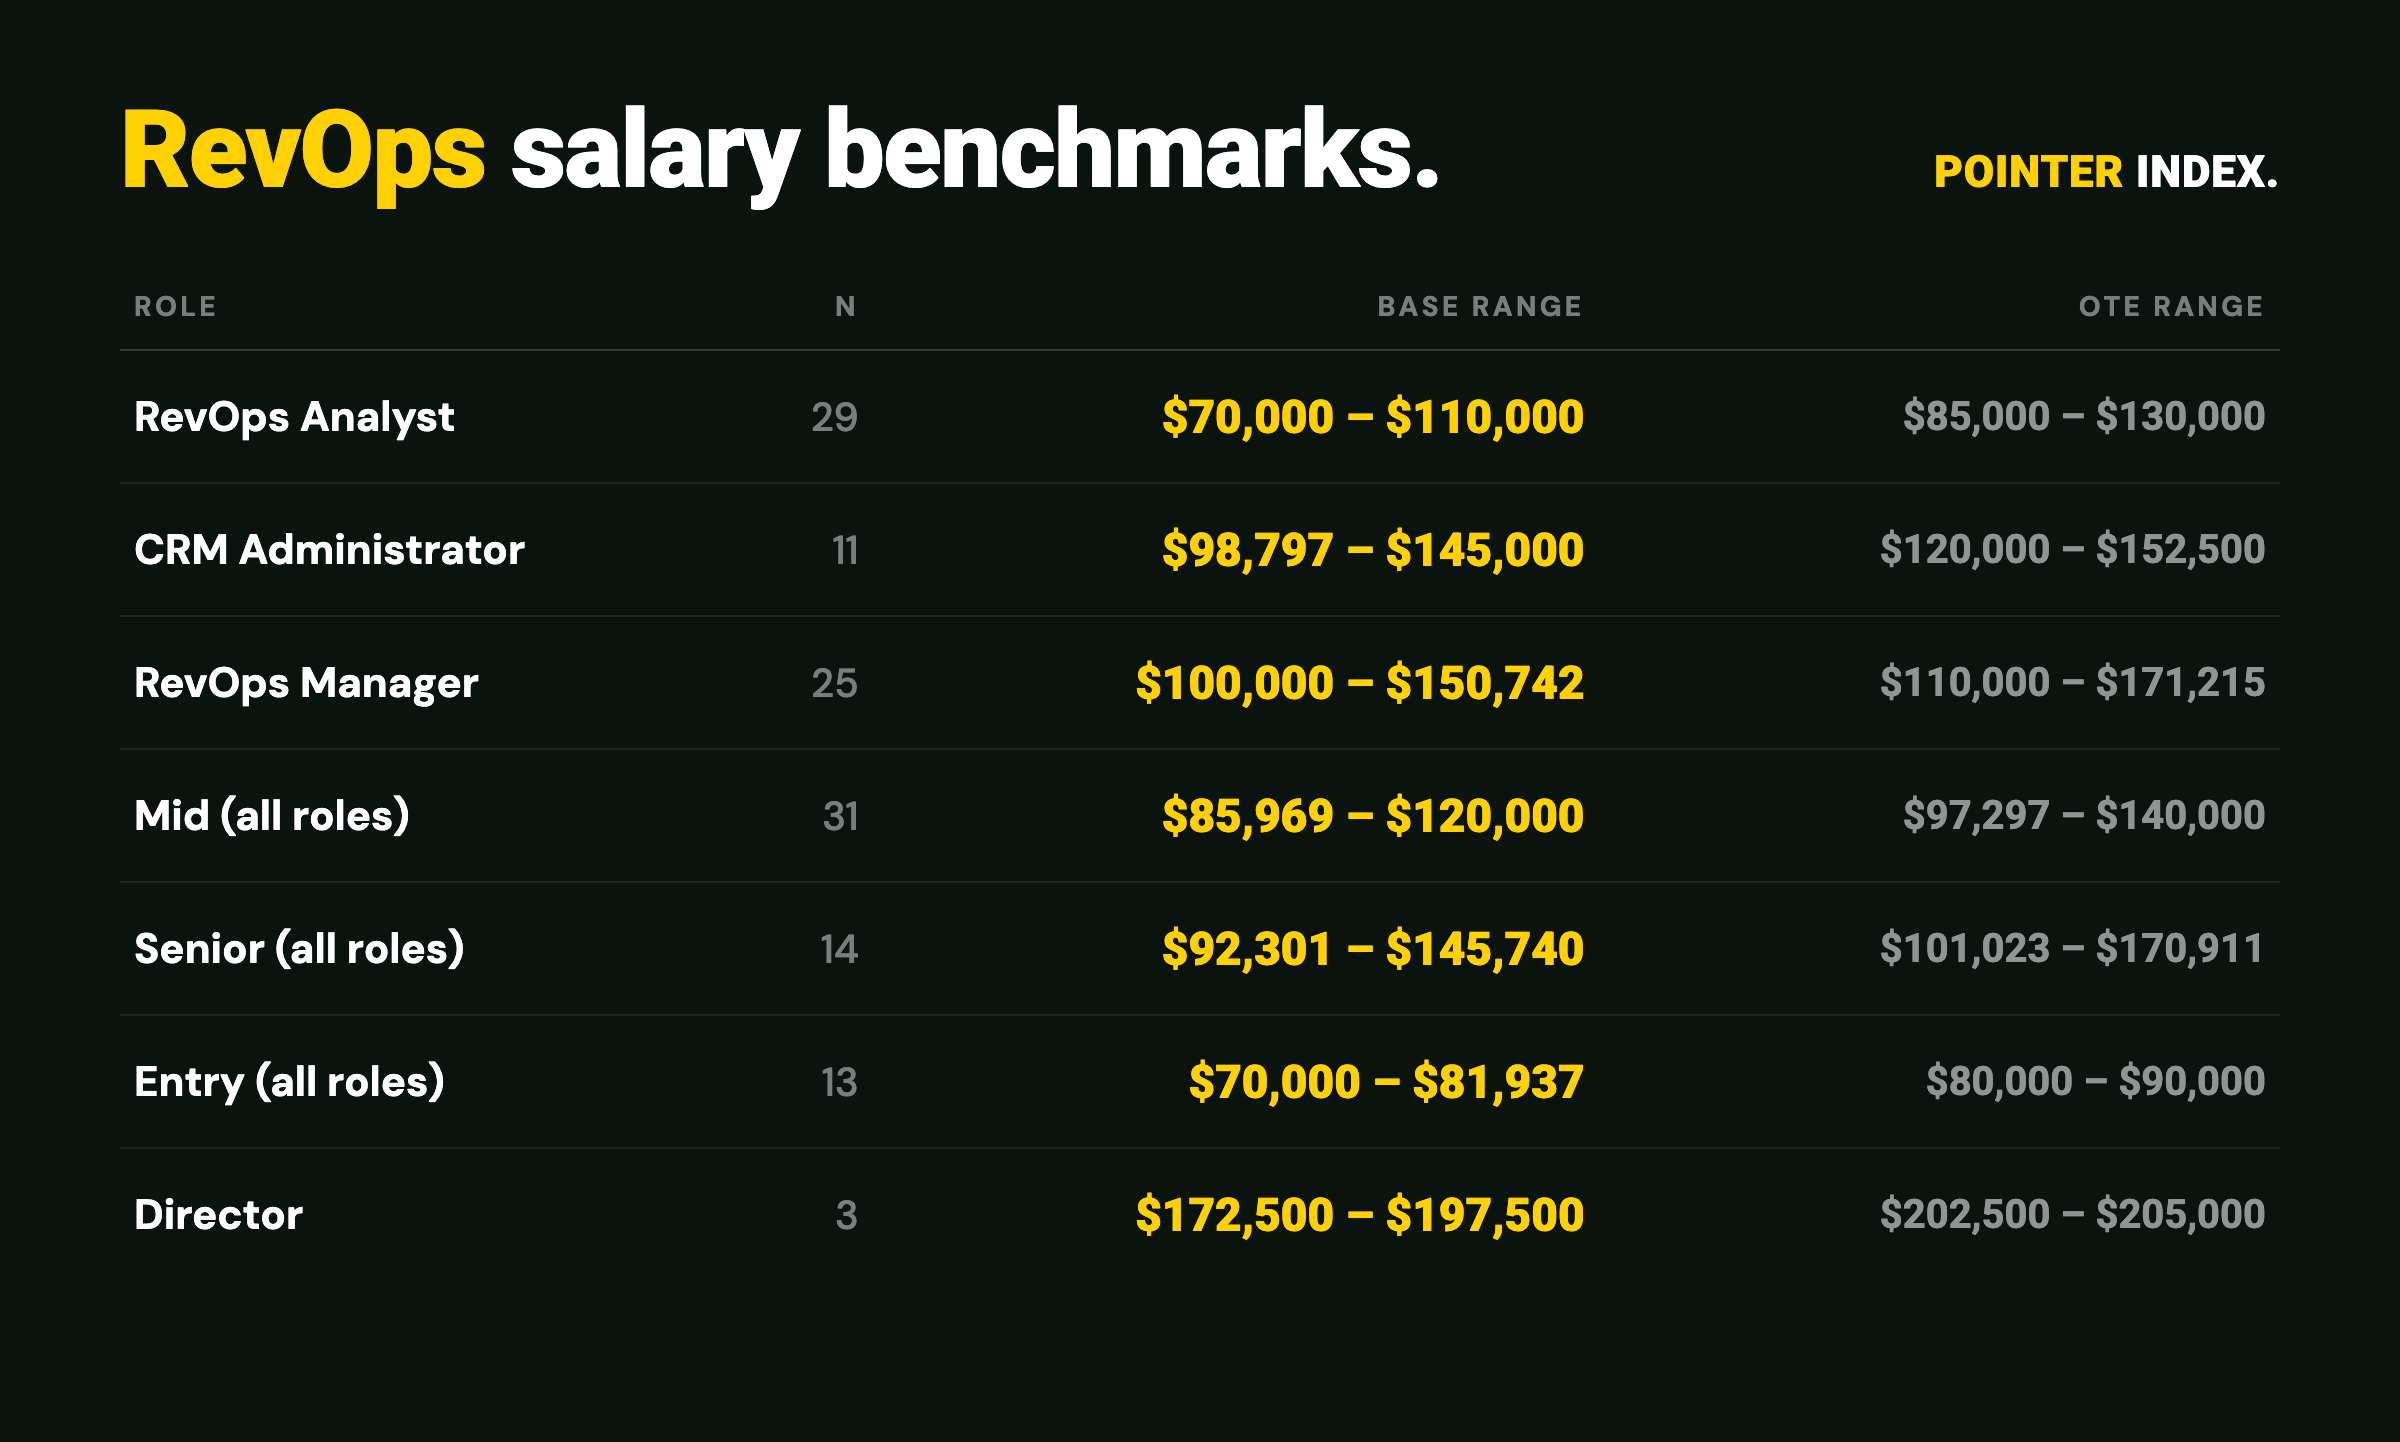
Live aggregates, ranges rather than bands. n shown per row; treat rows under n=10 as directional.
| Role / tier | n | Base range | OTE range |
|---|---|---|---|
| RevOps Analyst | 29 | $70,000 – $110,000 | $85,000 – $130,000 |
| CRM Administrator | 11 | $98,797 – $145,000 | $120,000 – $152,500 |
| RevOps Manager | 25 | $100,000 – $150,742 | $110,000 – $171,215 |
| Mid (all roles) | 31 | $85,969 – $120,000 | $97,297 – $140,000 |
| Senior (all roles) | 14 | $92,301 – $145,740 | $101,023 – $170,911 |
| Entry (all roles) | 13 | $70,000 – $81,937 | $80,000 – $90,000 |
| Director | 3 | $172,500 – $197,500 | $202,500 – $205,000 |
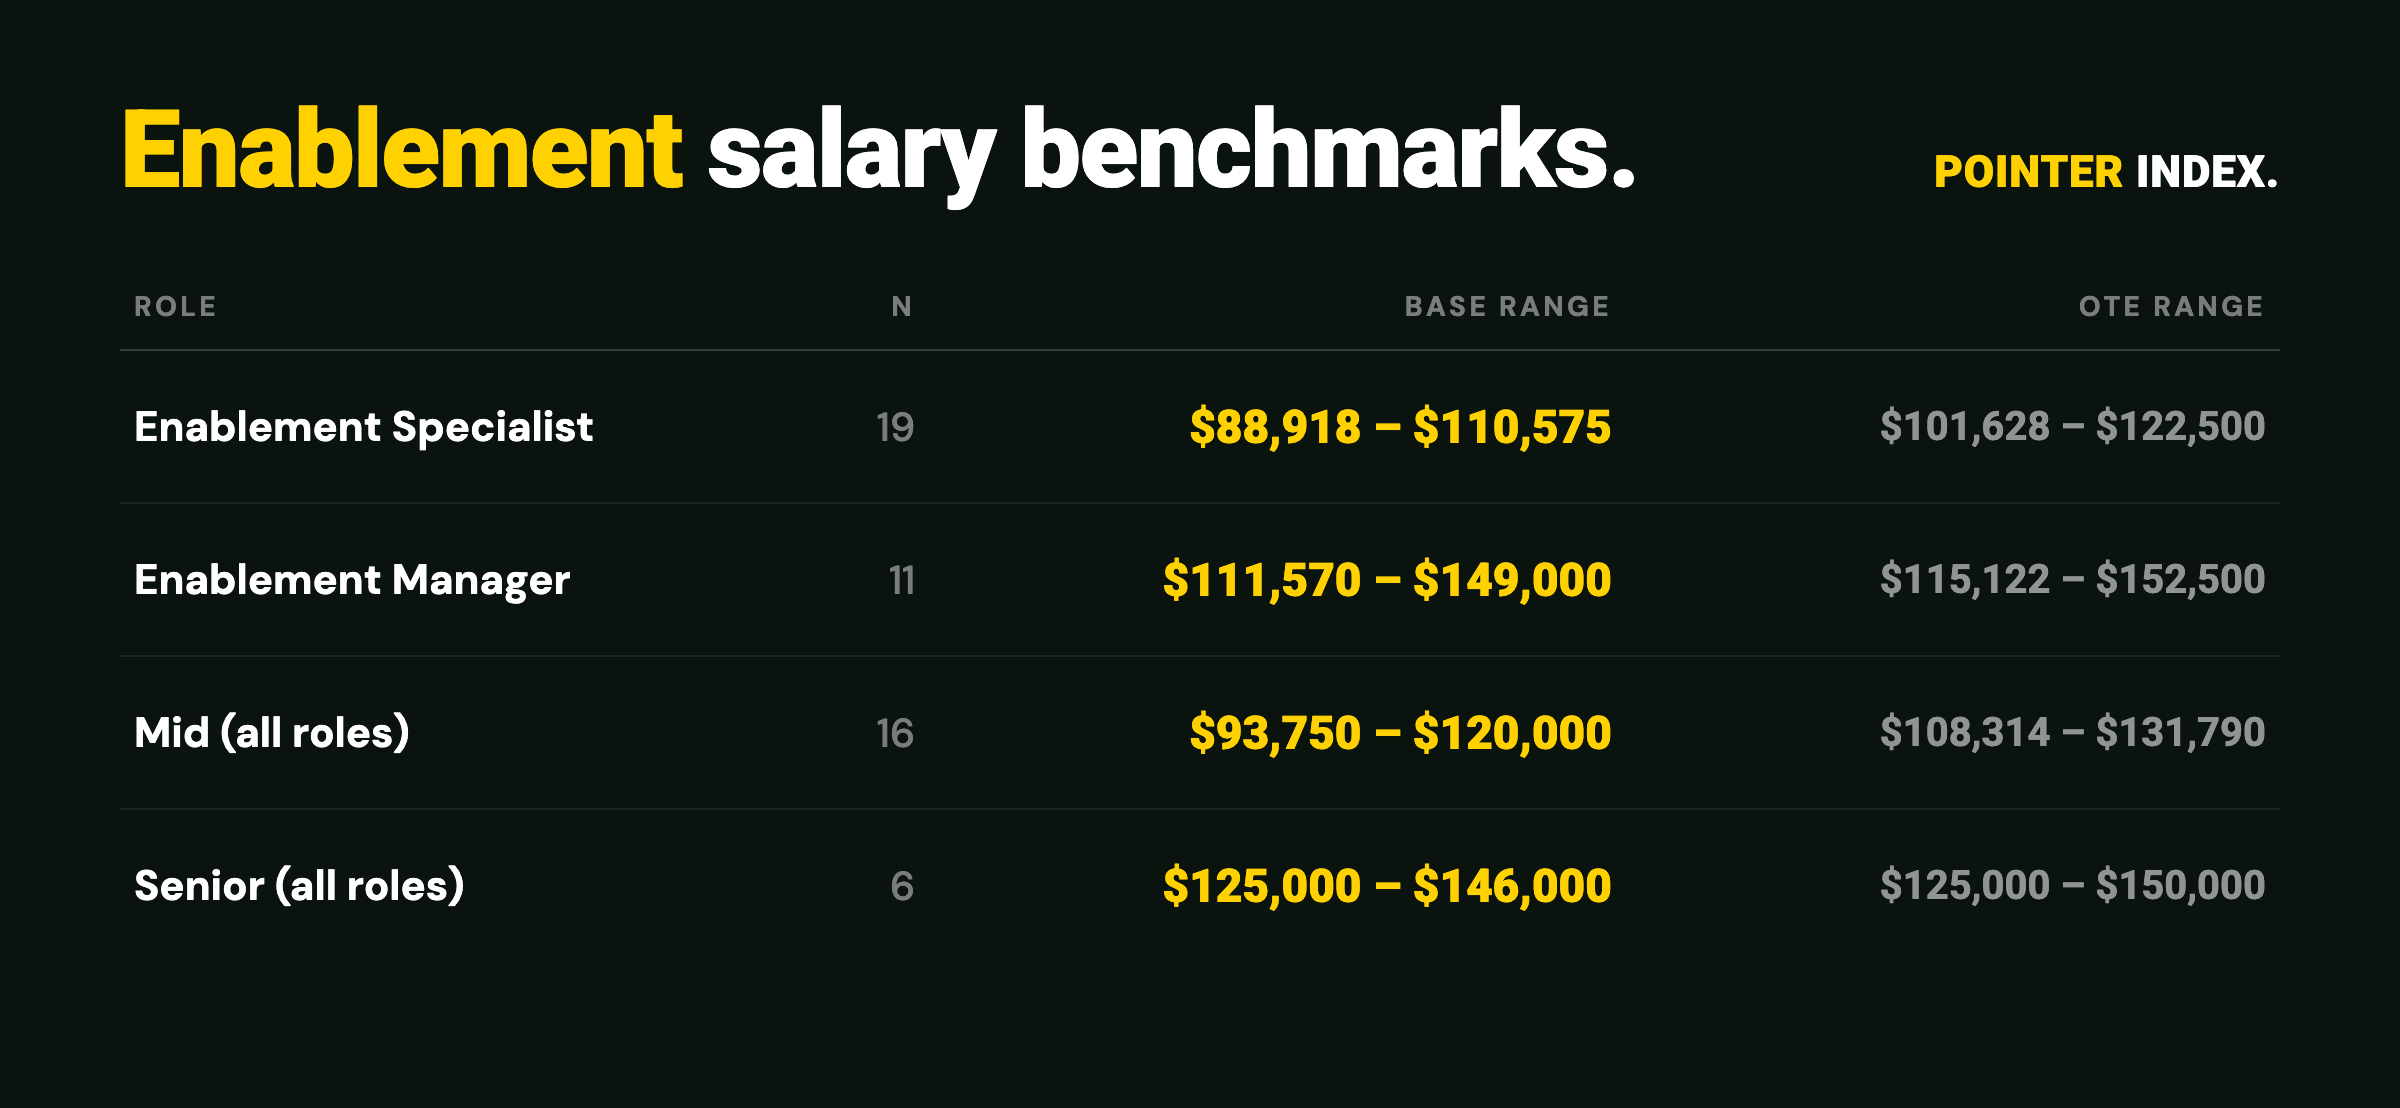
Enablement
| Role / tier | n | Base range | OTE range |
|---|---|---|---|
| Enablement Specialist | 19 | $88,918 – $110,575 | $101,628 – $122,500 |
| Enablement Manager | 11 | $111,570 – $149,000 | $115,122 – $152,500 |
| Mid (all roles) | 16 | $93,750 – $120,000 | $108,314 – $131,790 |
| Senior (all roles) | 6 | $125,000 – $146,000 | $125,000 – $150,000 |
Three things the full set says
The cheapest seat at the table is also the widest funnel. A BDR at entry medians $75k base with a $94k OTE. Three promotions later the same career path medians $175k base and $260k OTE as a VP. No other GTM function publishes a 3.5x earnings ladder inside one discipline.
"Strategic" is the highest-paid word in account management. Commercial AM medians $99k base. Move the same role to Key Accounts and it is $121k. National / Enterprise, $133k. The book defines the band, and the gap from bottom segment to top is $34k base for the same title.
RevOps and Enablement are still thin markets. Most rows on those two pages run on samples between 10 and 31, and leadership rows are thinner still. If you are hiring or negotiating in those functions, the ranges are honest but young. Contribute a submission and they sharpen.
So what
Candidates: find your row, then look one segment up, not one level up. The biggest pay moves in these tables are lateral, the same title against a bigger book or market segment (AE SMB to Enterprise, AM Commercial to Key Accounts) rather than waiting on a promotion.
Hiring managers: these bands are what your candidates read before your first call. If your req sits below the low band for the role, that is your time-to-fill diagnosis. And if your AM req keeps stalling, check whether you are pricing Commercial and describing Key Accounts.
One number to watch next week
Gross new roles: 4,518. Flat for three weeks. Above 5,000 next week and demand is genuinely returning. Under 4,000 and June starts to look like late May.
*Built from live ANZ data. Weekly index: point-in-time snapshot of active GTM roles at week close (n=6,092). Benchmark cards: a blend of 15+ published FY25/26 salary guides, 48.8k+ scraped job listings, community submissions, and Pointer placement records, identical to the live salaries pages as of 7 June 2026. RevOps and Enablement render from live aggregates with per-row n. The two views use different windows by design, which is why benchmark medians do not match the weekly index median. If a number looks wrong, reply to the newsletter or contact us. Corrections run in the next issue.*