

Issue 07 of The Pointer Index · Week ending 31 May 2026
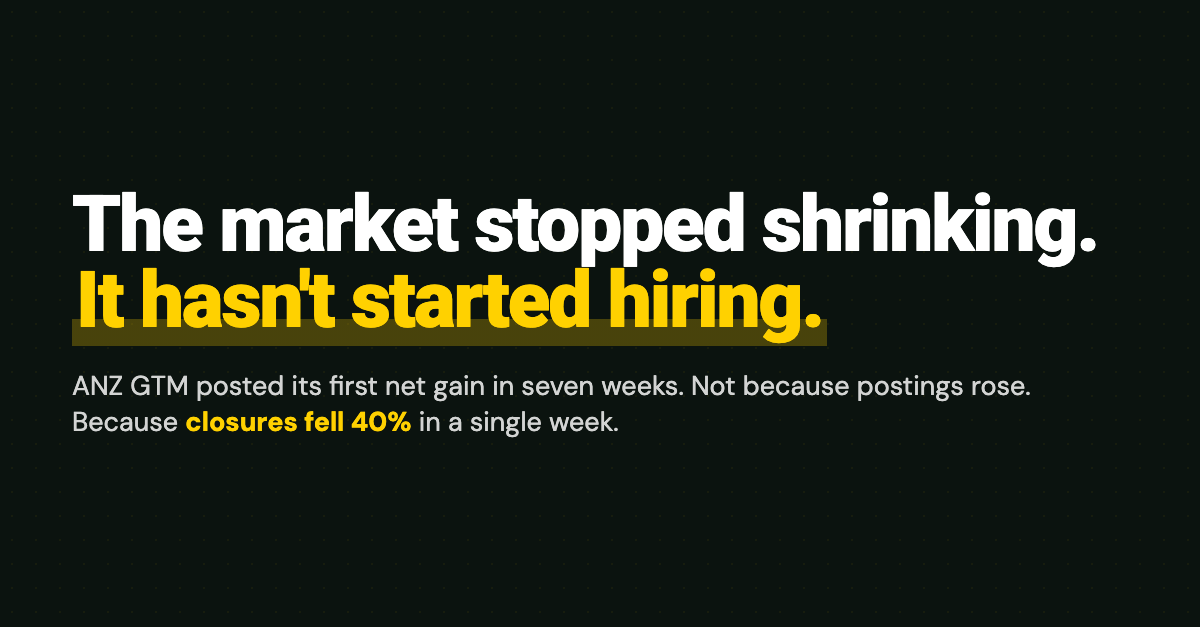
ANZ go-to-market hiring posted its first net gain in seven weeks. Companies opened 4,602 roles and closed 3,854, a net of +748. The active pool sits at 6,085, up 25% in seven days. After a month of red, the line finally turned up.
Now the part that matters. The rebound did not come from the side we told you to watch. Last week we said the tell was gross new postings: above 5,000 meant a real recovery, under 4,500 meant the contraction had another month in it. Postings printed 4,602. They stayed in the band they have held all quarter. Companies did not start posting more roles.
What changed is the other line. Closures fell off a cliff, from 6,470 last week to 3,854, a 40% drop in seven days and the lowest weekly closure count the tracker holds. The market stopped shrinking not because hiring picked up, but because roles stopped disappearing.
This is issue 07 of The Pointer Index, the monthly deep dive. One index, five numbers, one strong opinion. No filler. If a number's wrong, we fix it openly the next week.
The numbers
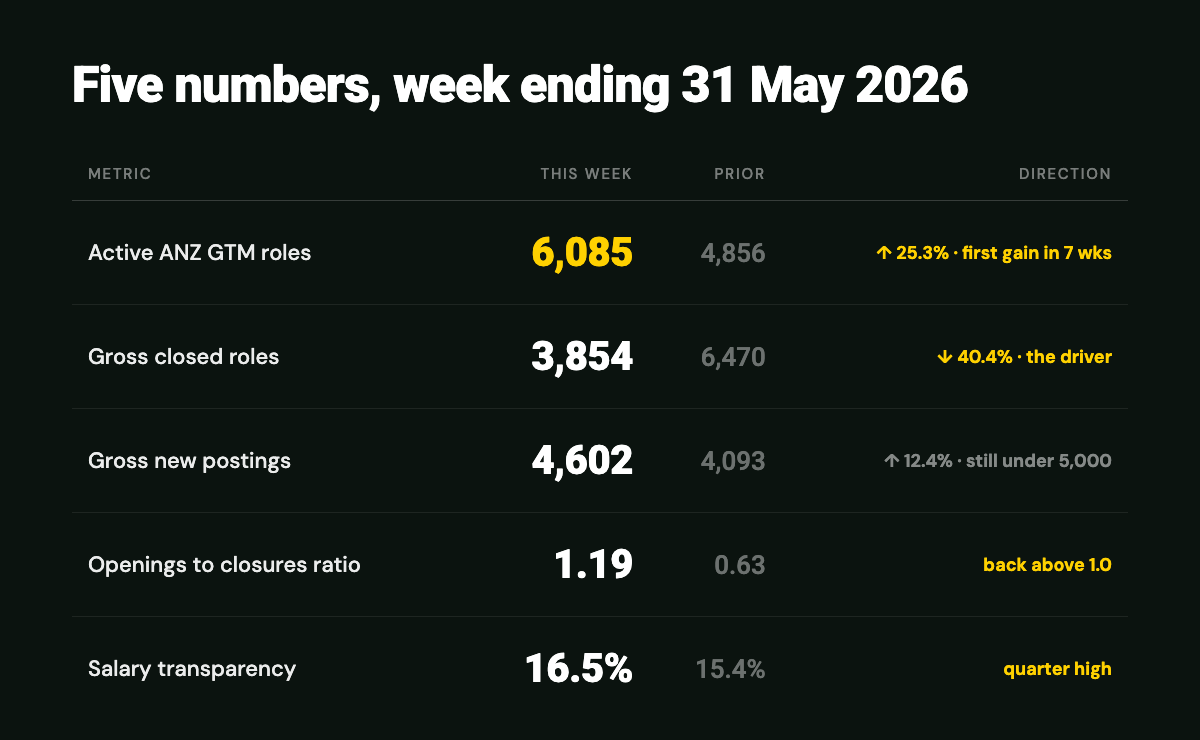
The five numbers say the same thing from five angles: the market turned, but it turned because the closing stopped, not because the hiring started.
Two reads beneath the headline
The closures story is the month. But the company-level data underneath it carries two findings that matter more than any single week of flows.
The first is about how ANZ companies sell.
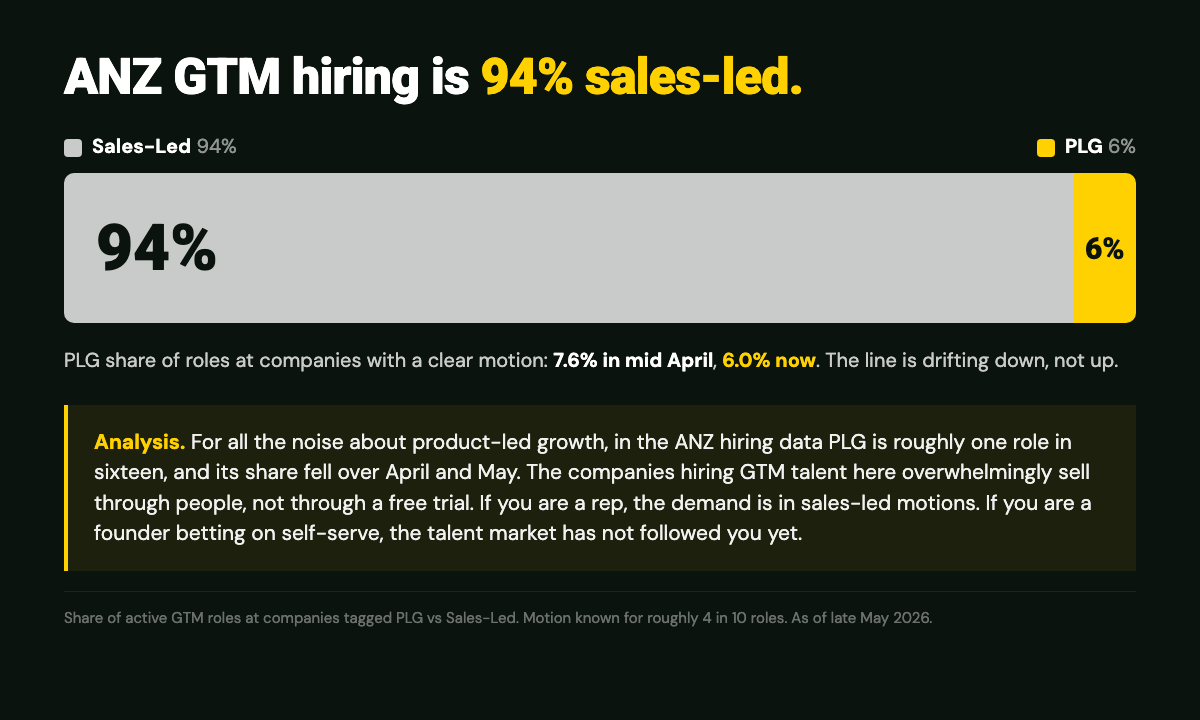
ANZ go-to-market hiring is overwhelmingly sales-led. Of the roles where the company's motion is known, 94% sit at sales-led companies and just 6% at product-led ones, a PLG share that has slipped from 7.6% in mid April to 6.0% now. For all the noise about product-led growth, in the ANZ hiring data PLG is roughly one role in sixteen, and the line is drifting down, not up. The companies hiring GTM talent here sell through people, not through a free trial. If you are a founder betting on self-serve, the talent market has not followed you yet.
The second is about who is actually adding seats.
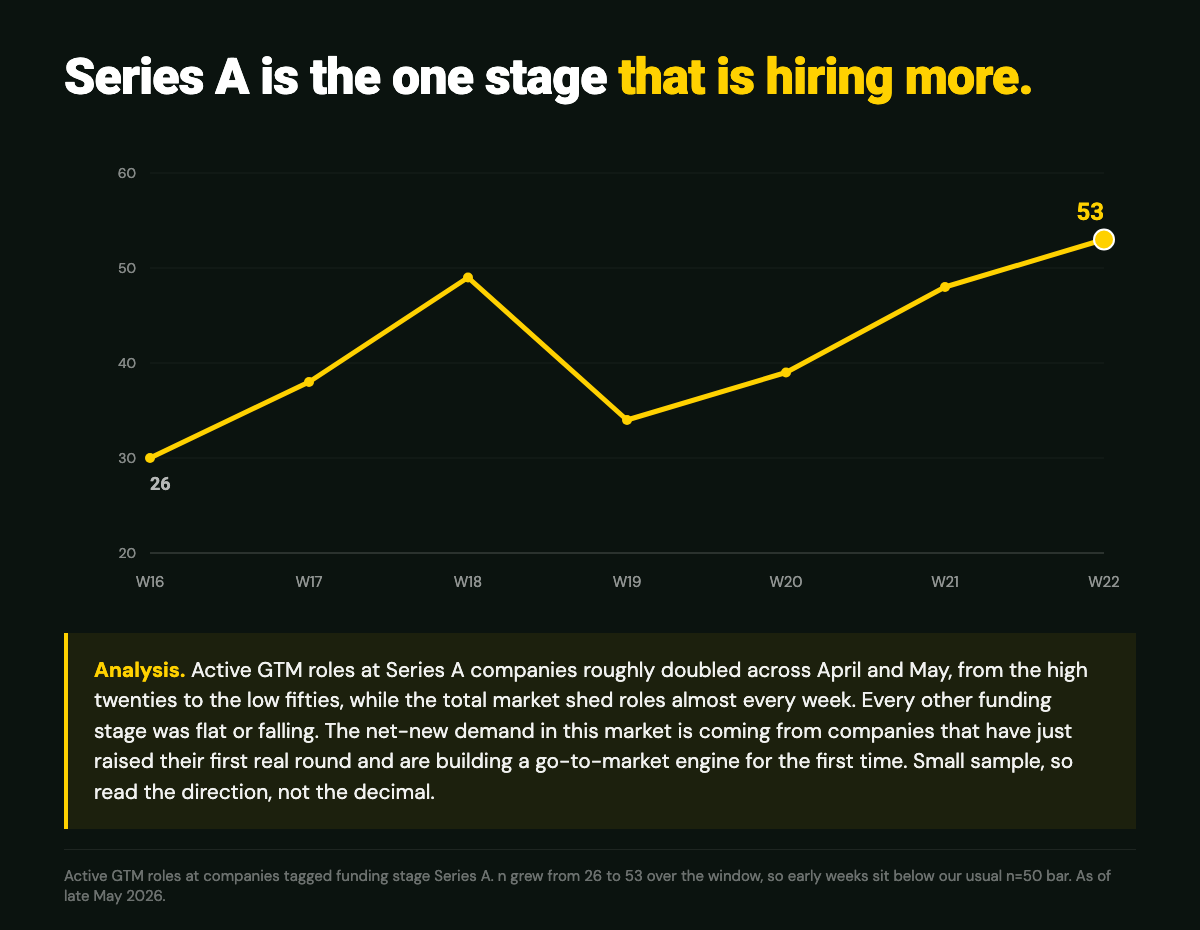
Series A companies are the one funding stage hiring more. Active GTM roles at Series A companies roughly doubled across April and May, from the high twenties to the low fifties, while every other stage was flat or shrinking and the total market shed roles almost every week. The net-new demand in this market is coming from companies that have just raised their first real round and are building a go-to-market engine for the first time. The sample is small, so read the direction, not the decimal, but the direction has held for six weeks.
What May actually did
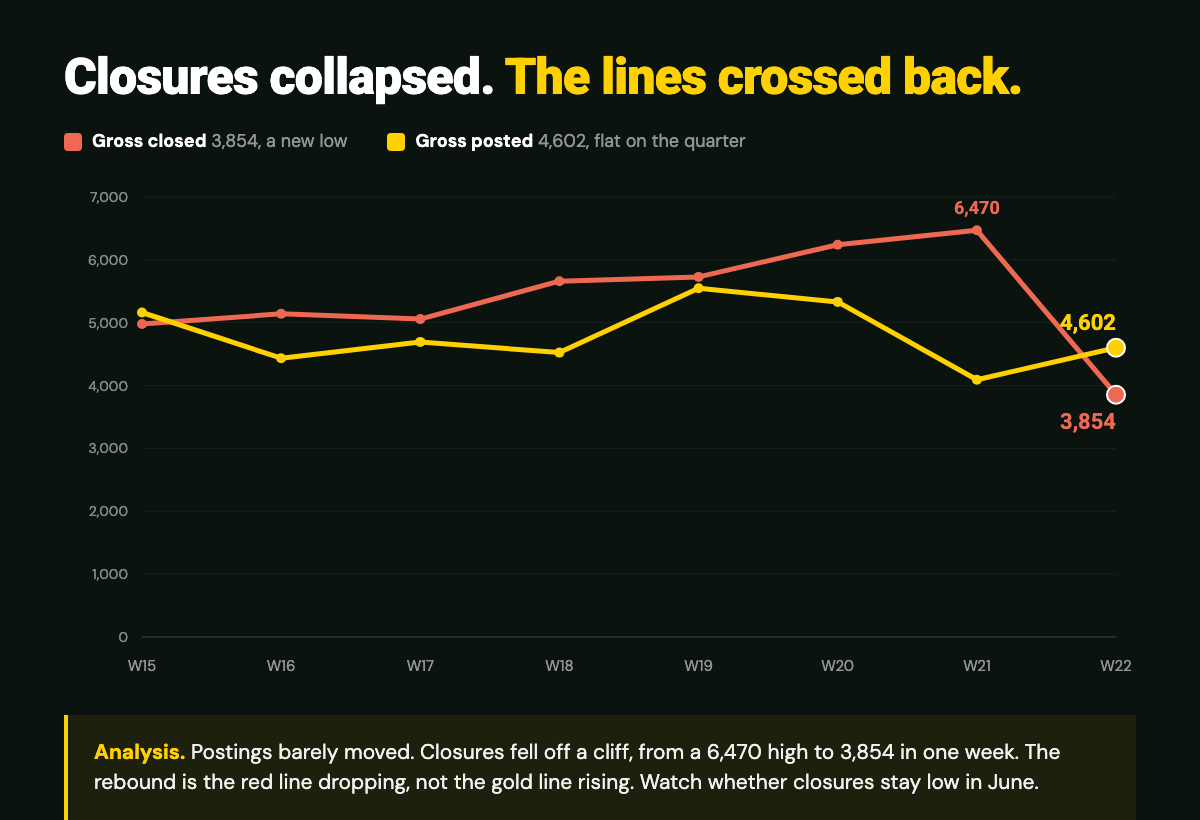
One green week does not erase four red ones. Add up the five weeks of May and ANZ companies closed 3,856 more GTM roles than they posted. The month was a net contraction. The final week was not.
The shape is the point. Postings have been the calm line all quarter, range bound between roughly 4,100 and 5,500 with no trend. Closures were the moving part. They climbed steadily from early April, crossed above postings in mid April, and peaked at 6,470 in the week ending 24 May. Then, this week, they collapsed.
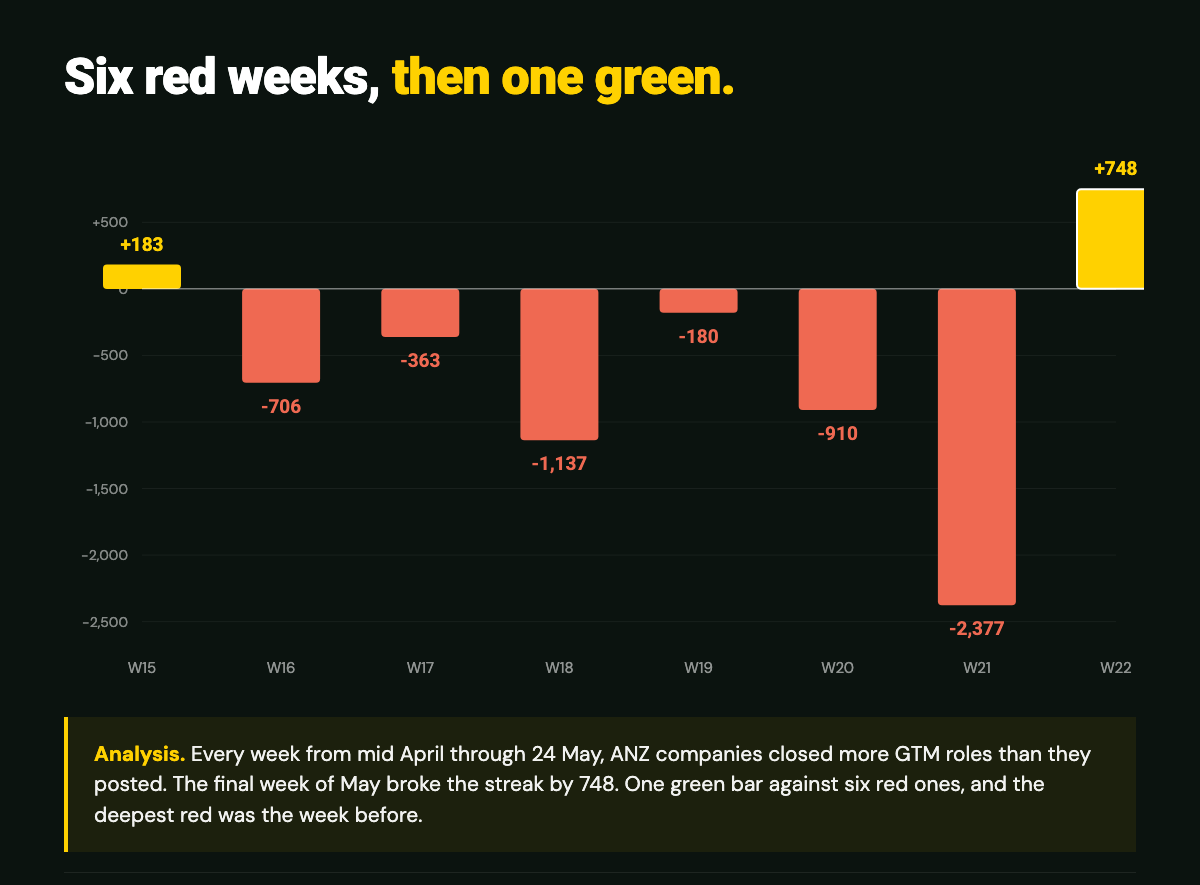
Plot the weekly net flow and the streak is stark. Six straight weeks where closures beat postings, the deepest at -2,377 in the week ending 24 May, then a single green bar of +748 to close the month. That is a clean story and a suspicious one. A 40% single week drop in closures is not how a healthy market normally behaves. Three readings are consistent with the data, and the dataset cannot yet split them. One, the late May surge of budget driven role cancellations has run its course and the bleed is genuinely over. Two, roles that would have closed simply have not been detected as closed yet this week, and the number revises up. Three, the financial year end clear out finished early and June resets to trend. We will know within two weeks which of these it was.
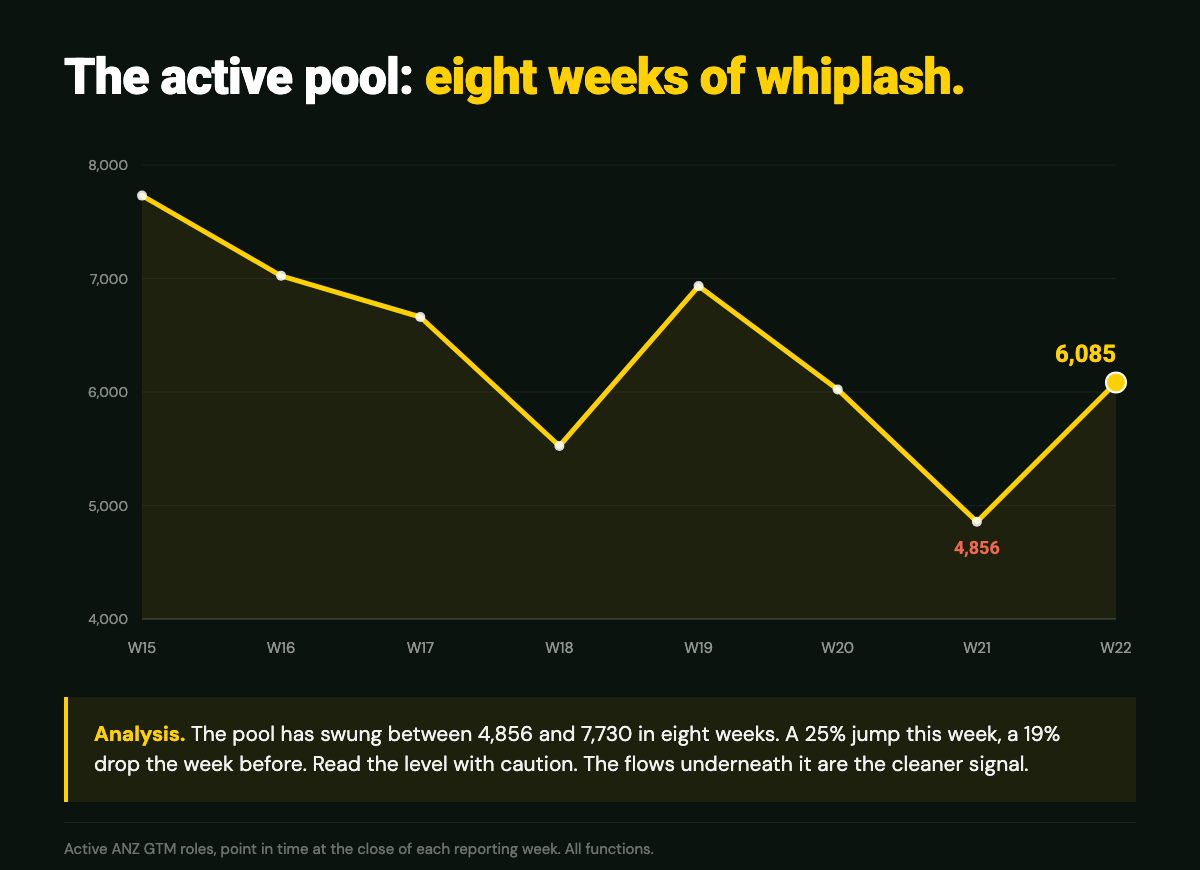
The active pool itself is the noisiest line we track. It has swung between 4,856 and 7,730 in eight weeks, a 25% jump this week against a 19% drop the week before. Do not read a single week's level as a trend. The flows underneath the pool are the cleaner signal, and they are the ones worth watching.
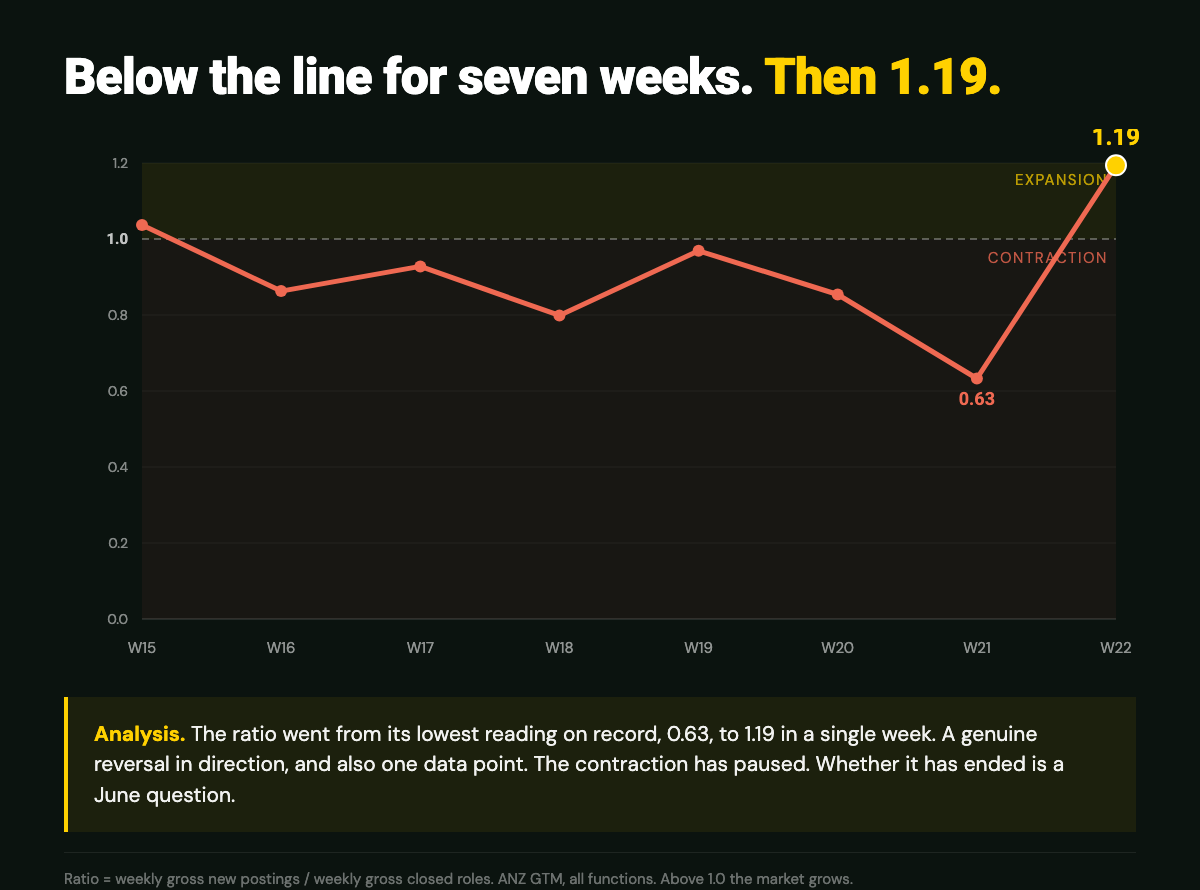
The openings to closures ratio is the cleanest read of all. Above 1.0 the market grows, below it contracts. The line spent seven straight weeks below 1.0, bottomed at 0.63, and this week printed 1.19. That is a real reversal in the ratio. It is also one week. The honest position is that the contraction has paused. Whether it has ended is a June question.
Where the roles went
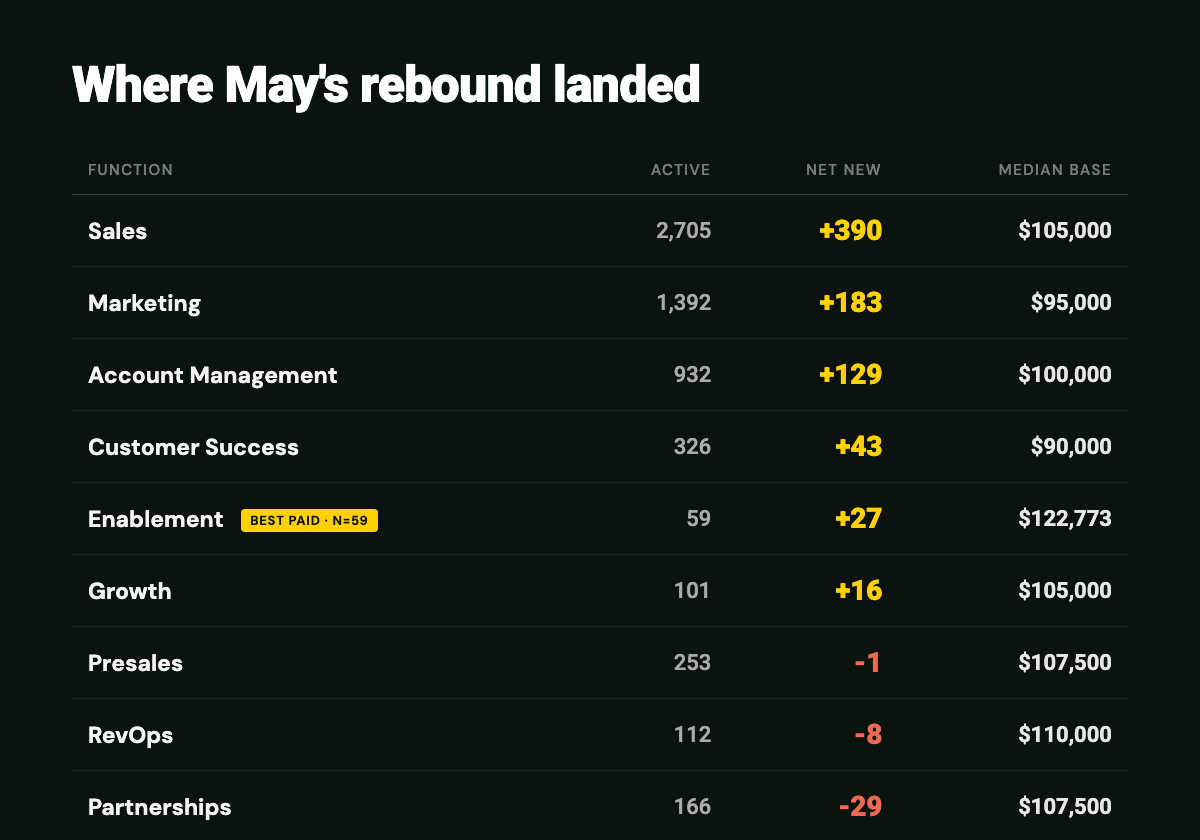
The rebound was broad but top heavy. Sales added a net 390 roles, Marketing 183, and Account Management 129. Those three functions, the largest three in the index, drove almost the entire weekly gain. Customer Success added 43 and Growth 16.
The standout on a per capita basis is Enablement. It added a net 27 roles on an active base of just 59, the steepest relative move of any function that clears our sample threshold. Enablement also carries the highest median base in the index at $122,773, well above Sales at $105,000 and the $100,000 market median. The smallest publishable GTM function is the best paid and, this week, the fastest growing. That is the third issue in a row the enablement signal has pointed the same way.
Two functions went the other way. Partnerships shed a net 29 roles, its weakest week in the data and the only mid sized function still clearly contracting. RevOps gave back 8. If you are reading the rebound as a green light, note that it did not reach every desk.
Read it like this. May was a contraction month that ended with a pause, not a recovery. The active pool turned positive on the strength of one line moving, closures, while the line that signals real demand, new postings, stayed flat. Treat the +748 as the bleeding stopping, not the patient standing up. The functions that led, Sales, Marketing, Account Management and Enablement, are where June's first real hiring will show if it shows at all.
What the quarter is quietly doing
Underneath the week-to-week noise, two lines have ignored the contraction entirely and trended in a straight direction all quarter.
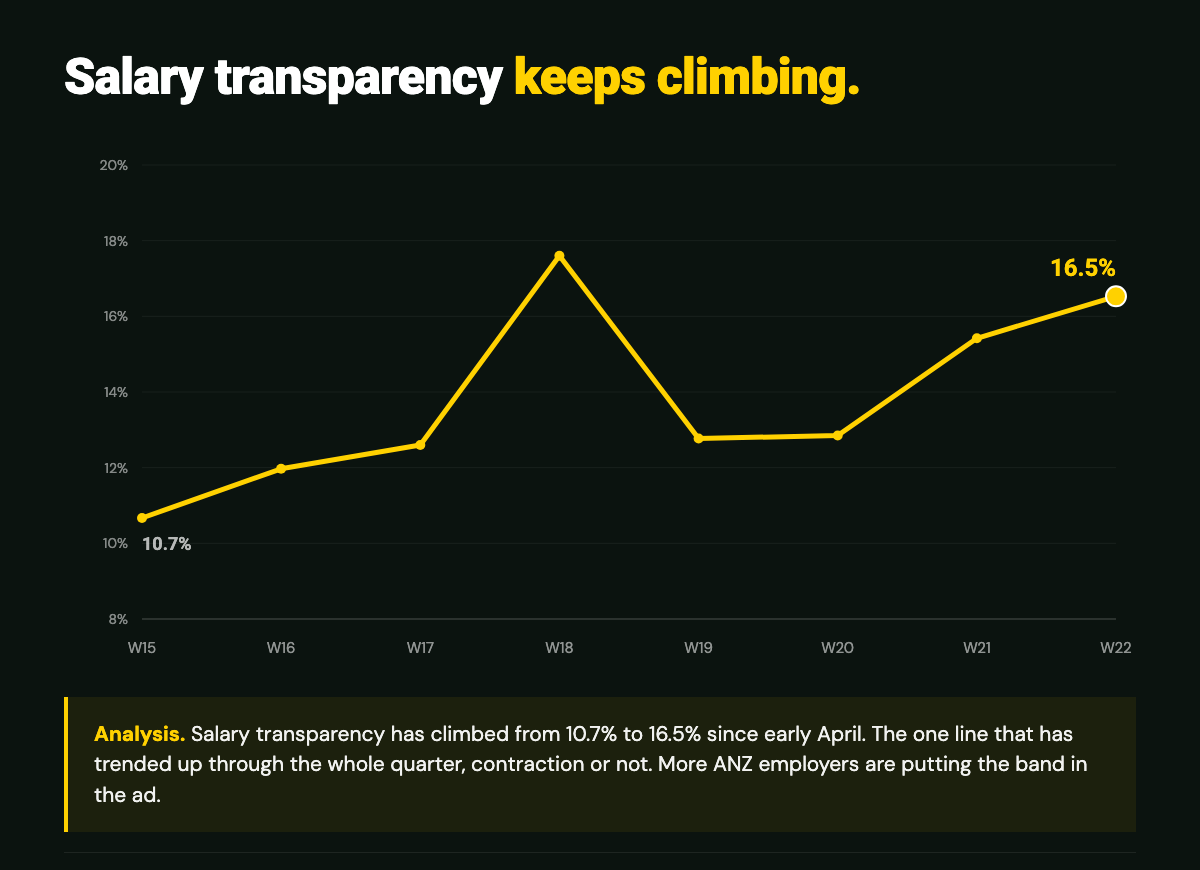
The first is salary transparency. The share of ANZ GTM listings that disclose a band in the ad has climbed from 10.7% in early April to 16.5% now, and it has risen in most weeks regardless of what the hiring volume did. A contracting market has not made employers more secretive about pay. If anything the opposite: when candidates have more leverage and more open roles to choose between, the ads that name the number get the clicks. We expect this line to keep climbing.
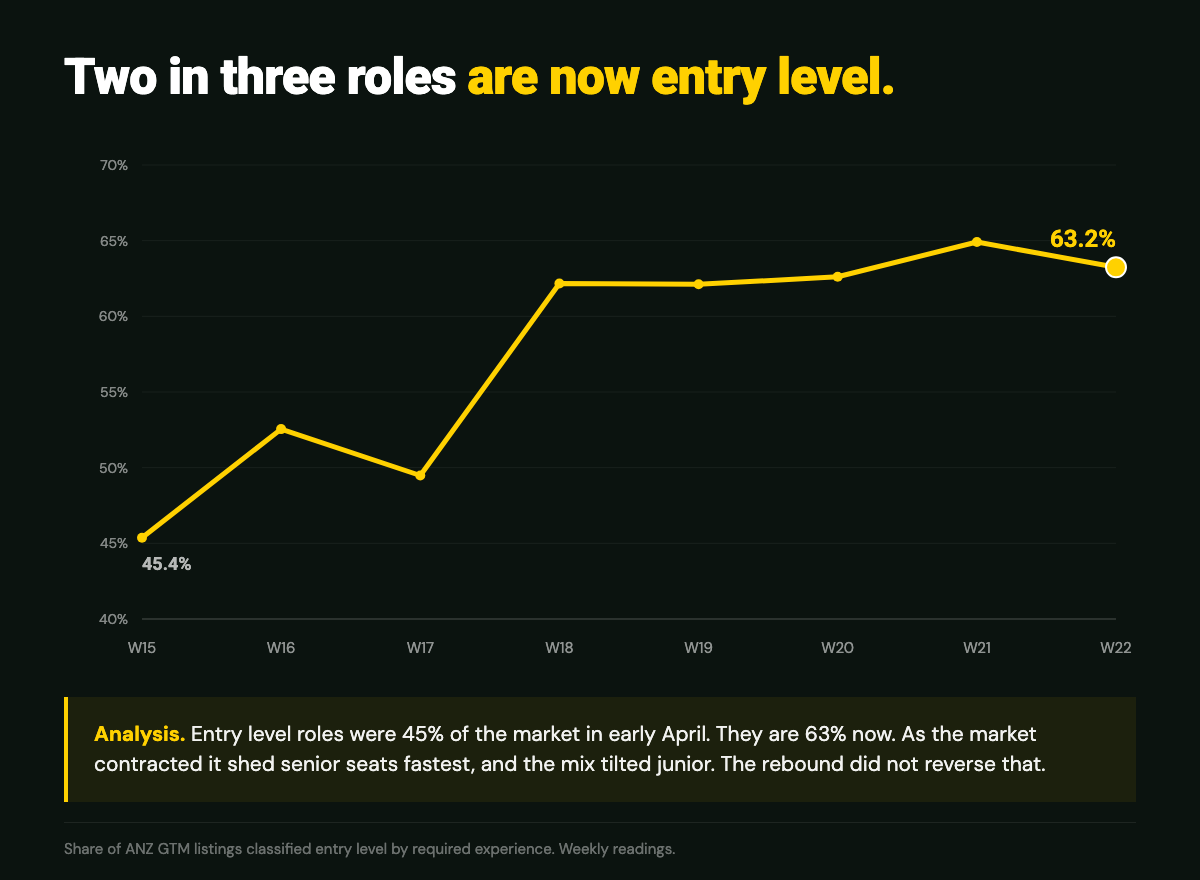
The second is the experience mix. Entry level roles were 45% of the market in early April. They are 63% now. As the market contracted it shed senior and leadership seats fastest, and the mix tilted junior. Leadership load this week sits at 0.9%, near the floor of the quarter. The rebound did not reverse any of this. The roles coming back first are the cheaper, more junior ones, which fits a market testing whether the recovery is real before it commits to expensive senior hires.
So what
If you're a CRO or CMO, the capacity you have been watching shed for a month just stopped shedding, but the buyer's market has not closed. Passive candidates who surfaced during the contraction are still in the funnel and your competitors have mostly not reopened their seats. If you have an approved req, this is still a good week to move on it. If you are waiting for the market to confirm a recovery before you hire, the data will not give you that confirmation in June, only direction.
If you're a hiring manager, median time on market held at 3.9 days. Listings still come off the boards fast, so the rebound has not slowed the clock. Run your loop as if speed still wins, because it does.
If you're a candidate on the market, there are more open roles in your function than there were last week, concentrated in Sales, Marketing, Account Management and Enablement. The catch is the same as last month: 3.9 days is how fast a listing disappears, not how fast it fills. Apply the day you see it. If you are in Partnerships, the market is still thin and you should widen your search radius.
One number to watch next month
Gross closed roles. This week 3,854, down 40% in a single week. If closures stay near this level in June, the contraction genuinely ended in late May and the +748 was the turn. If they snap back above 5,500, this week was a data artifact or a financial year end pause, and the active pool gives the gain straight back. The postings line told us little this month. The closures line is now the whole story.
Hire ANZ GTM talent with Pointer Strategy
We place sales, marketing, CS, RevOps, enablement, and partnerships leaders across Australia and New Zealand. Every search is informed by the same data feed that powers The Pointer Index.