Issue 03 of The Pointer Index · Monthly Review · 4 May 2026
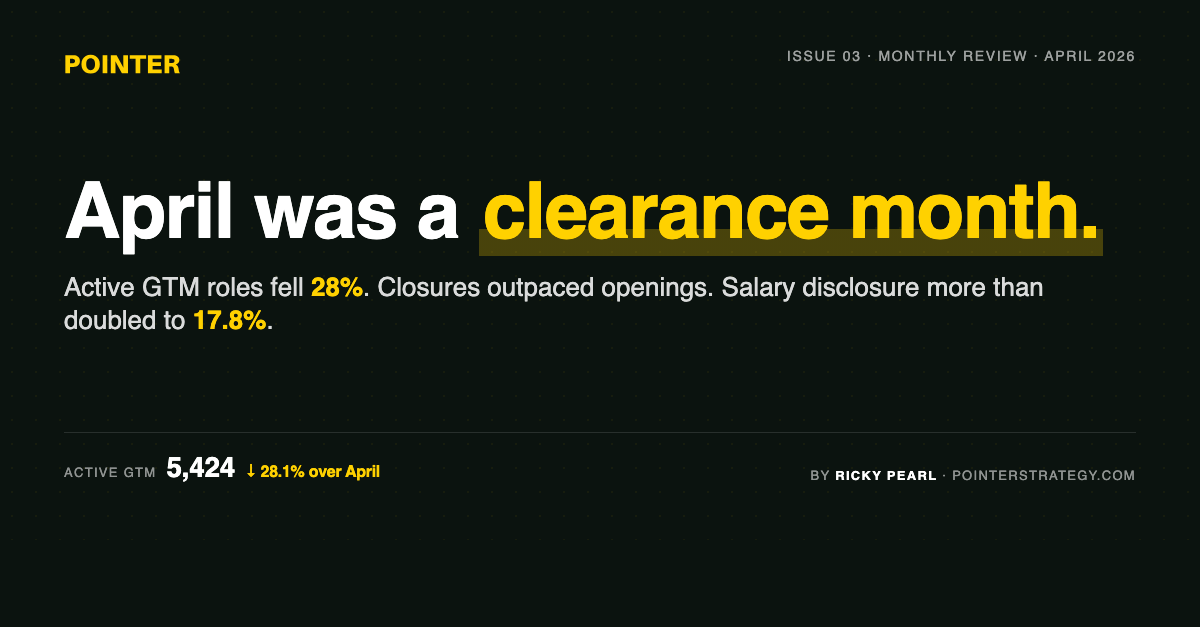
April 2026 was a clearance month for Australian and New Zealand go-to-market hiring (sales, marketing, customer success, presales, partnerships, RevOps, growth, enablement, product marketing and GTM engineering roles).
The market did not grow. It shed inventory faster than it restocked, and what came back into the pool was disclosed more openly than at any point in our continuous record.
Five facts to take away.
The Index: five numbers for April
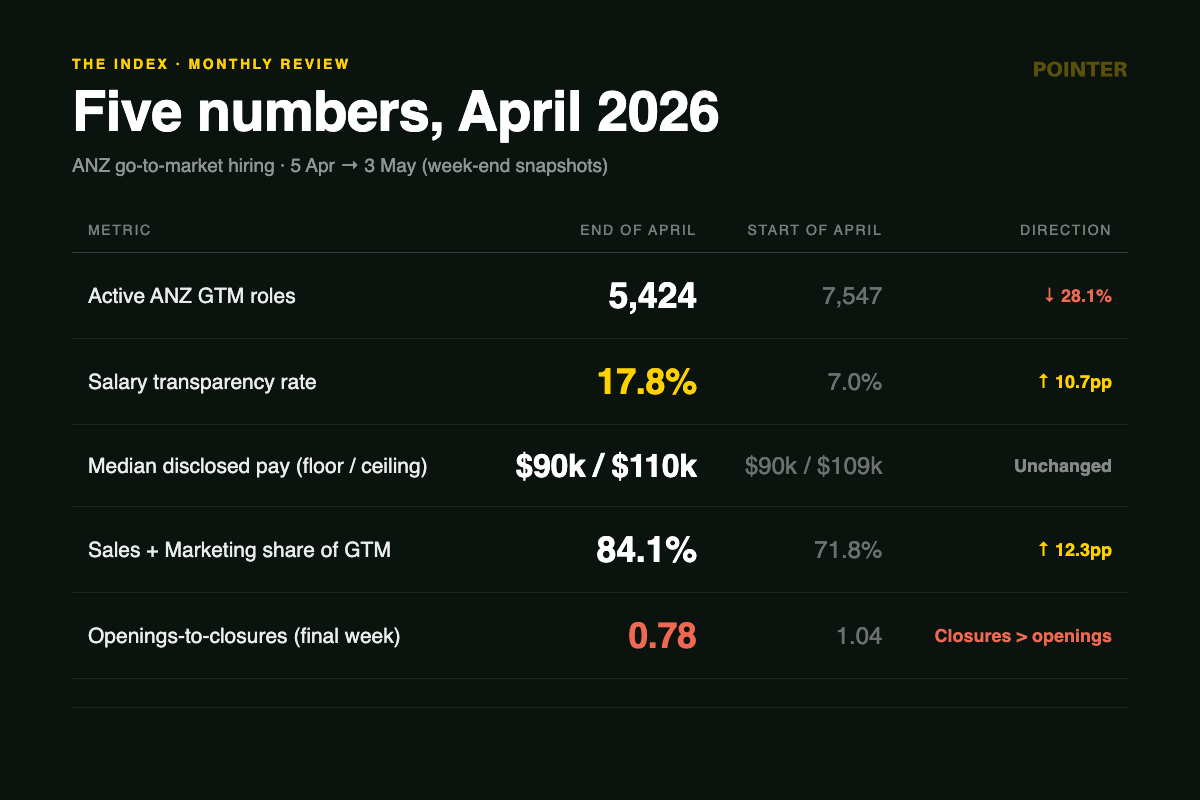
The five April readings, start-of-month to end-of-month:
Pay holds. Volume falls. Disclosure surges. Two functions hold most of the market while the rest contract. That is a market clearing inventory and consolidating, not a market collapsing. The live counts continue to update on our ANZ GTM market data dashboard.
The clearance pattern
The April story is not a single move. It is two moves running together: an inventory clearance and a disclosure upswing.
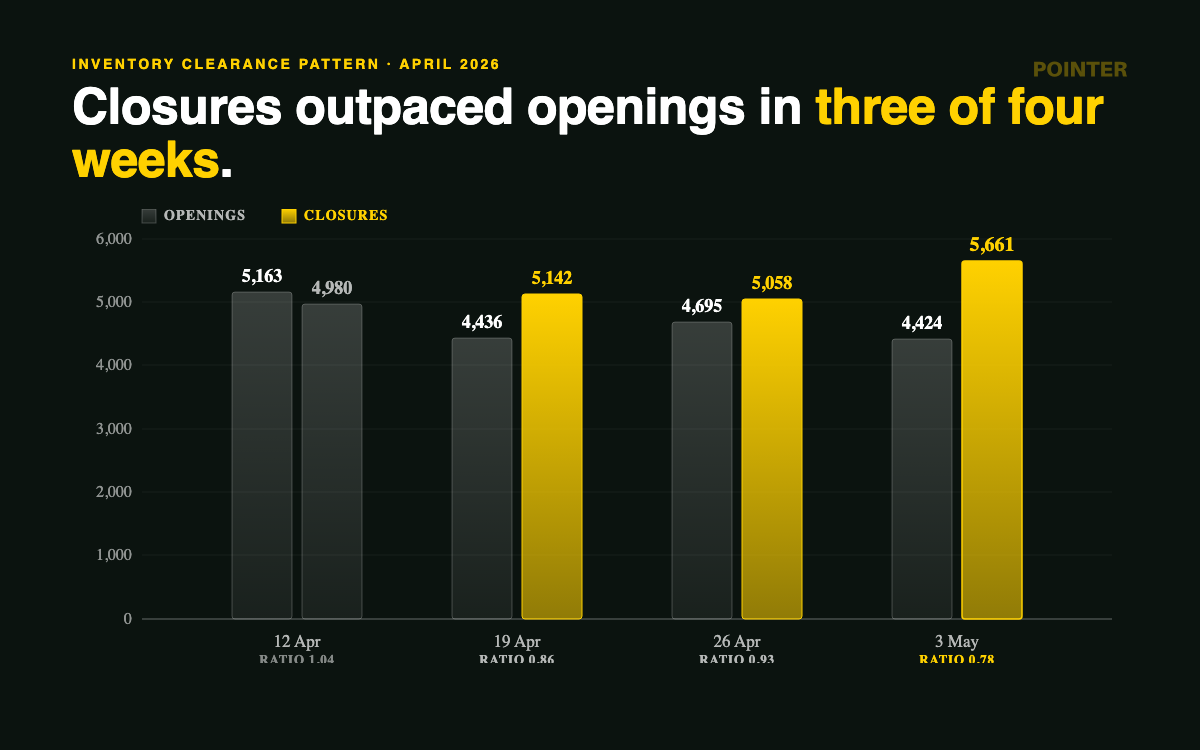
The inventory side first. Week-by-week:
Three weeks in a row of closures exceeding openings, ending with the widest gap on record. New role creation is steady (4,400 to 5,200 each week) but the closure rate accelerated through the month and peaked in the final week. Employers are not just hiring less. They are clearing pipelines of reqs that have not converted.
The closure rate also explains the median-days-on-market move. Median days a current active role has been open dropped from 5.0 in week 4 to 3.3 in the final week. That is not because hiring sped up. It is because the older reqs got pulled, leaving a younger pool behind.
Function-by-function: where the cuts landed
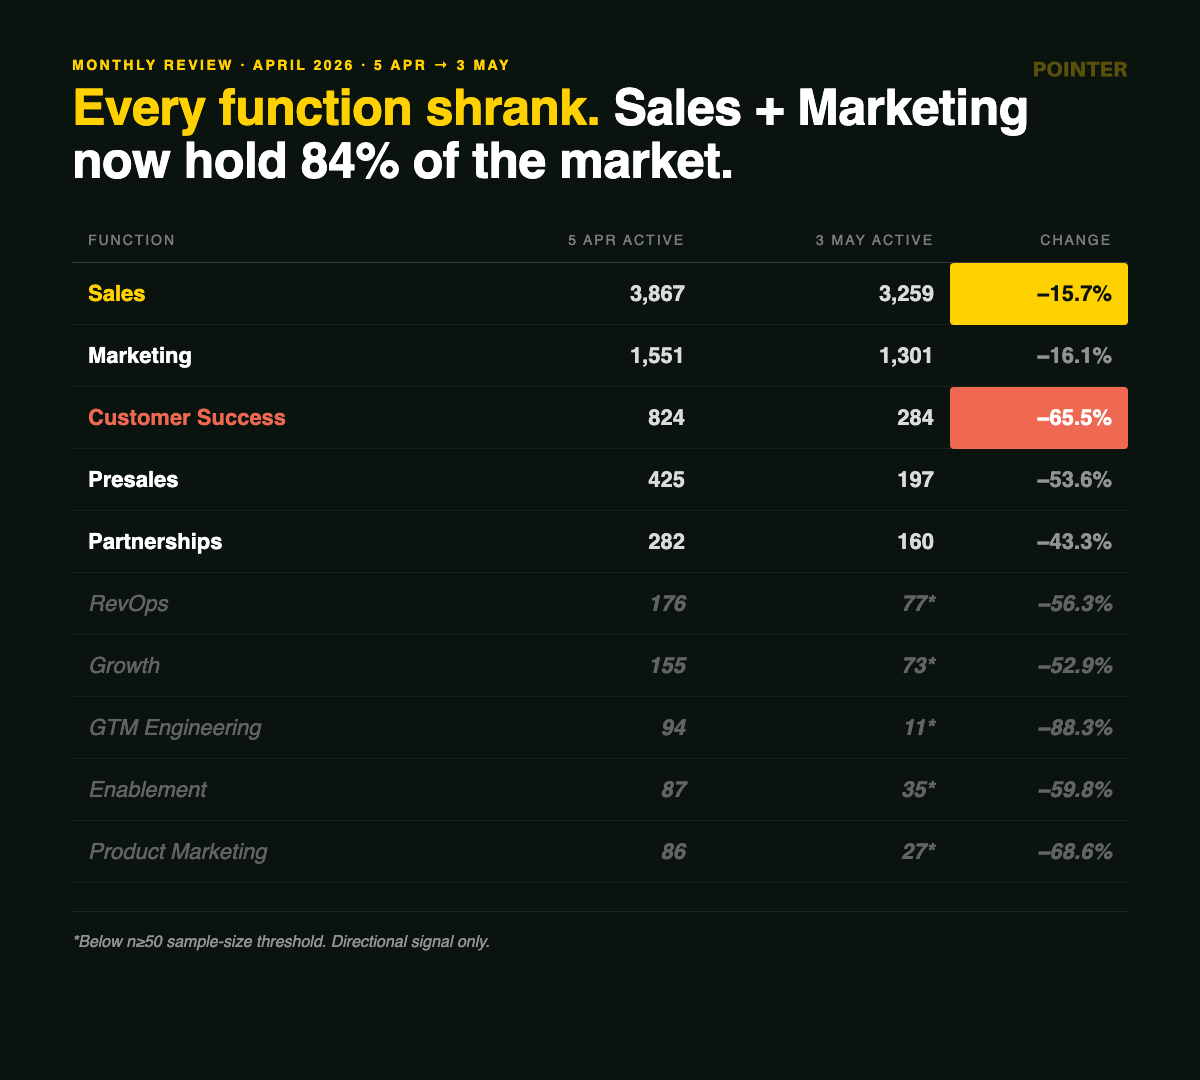
Every function contracted in April. The market consolidated into two functions: Sales and Marketing together rose from 71.8% of all active GTM roles to 84.1%. Customer Success, Presales and Partnerships, taken as a block, fell from 1,531 active roles to 641, a 58.1% drop. The headline question is which contracted least.
By function, ranked smallest contraction to largest, start-of-month → end-of-month active roles:
*Cohorts marked below sample threshold sit under the n≥50 minimum this Index uses to publish function-level breakdowns. Directional signal only; we exclude these from any pay or transparency analysis.*
Sales (3,867 → 3,259, −15.7%). The smallest contraction of any function and the only one under 30%. Median disclosed pay sat at $90k floor / $110k ceiling all month. Sales transparency rose from 7.6% to 17.9%, the largest absolute movement of any major function.
Marketing (1,551 → 1,301, −16.1%). Second-smallest contraction. Median disclosed pay $85k floor / $98k ceiling at month-end. Marketing transparency climbed to 19.1%, the highest in any function.
Customer Success (824 → 284, −65.5%). The steepest contraction of any function above sample threshold. CS active roles fell by nearly two-thirds in four weeks. Median disclosed pay at month-end sat at $80k floor / $110k ceiling. The CS open req pool fell by more than half. Candidate-side supply is not directly observable in this dataset, but for hiring managers with a CS hire pending the posting-side balance is the most favourable on record.
Presales (425 → 197, −53.6%). Lost more than half its active book. The most expensive function in the latest snapshot, with median floor $120k and ceiling $150k. Presales is also the transparency outlier: at 6.6% disclosure it sits roughly 12 percentage points below Sales, Marketing, CS and Partnerships, which all clustered between 17.9% and 19.1% in the latest week. The Presales disclosed sample is thin (n=13 disclosed bands within a 197-role active pool), so we report this as a current reading rather than a confirmed lag.
Partnerships (282 → 160, −43.3%). Median disclosed pay held around $110k floor / $120k ceiling. Transparency climbed from 5.0% to 18.8%, one of the larger functional shifts on disclosure.
RevOps, Growth, Enablement, GTM Engineering and Product Marketing are below the n≥50 threshold by month-end. We flag the directional contraction but do not publish function-level pay or transparency for these cohorts in this issue. They will return to the Index when sample sizes recover.
The pay story: employers cut volume before they cut bands
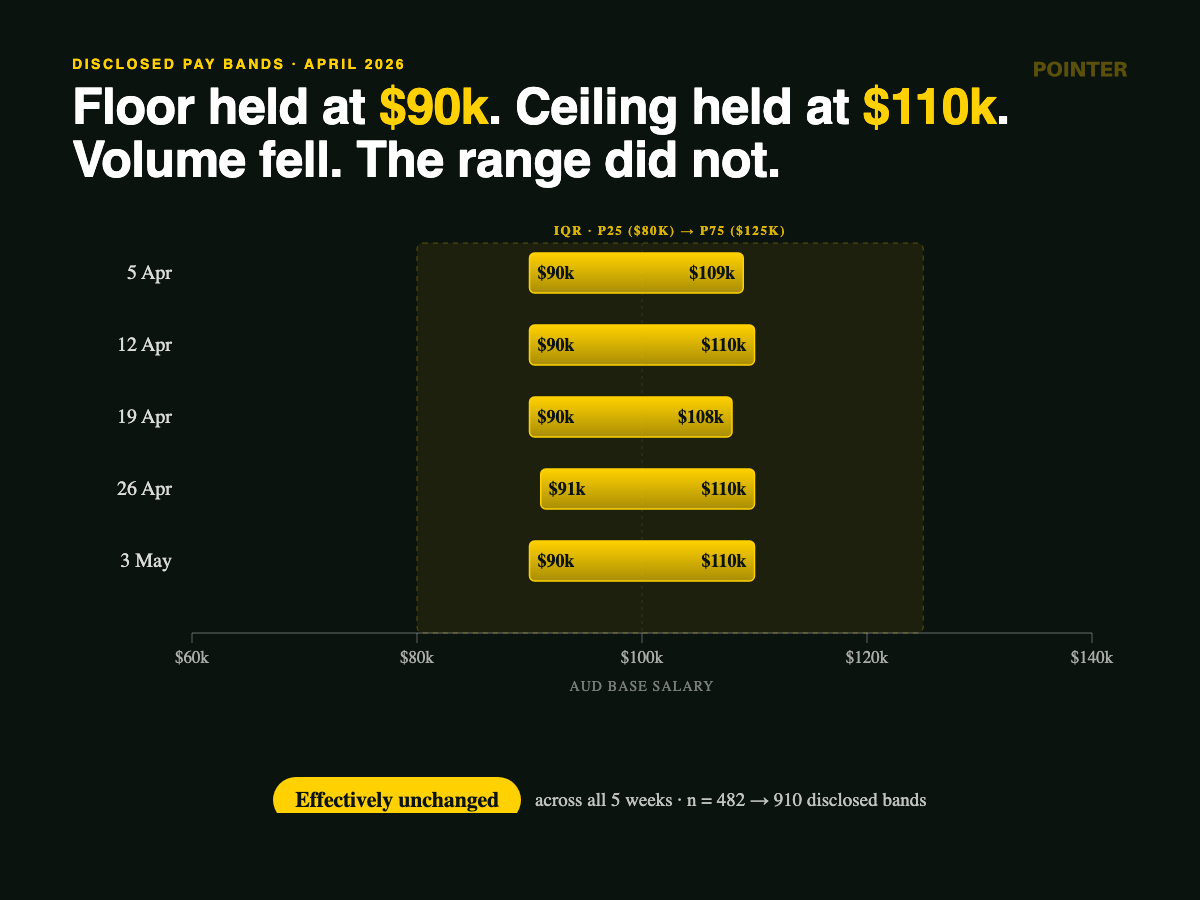
The first thing employers cut was role volume, not advertised pay. Median disclosed pay floor held at $90,000 every week. Median disclosed ceiling held at $110,000 every week. The interquartile range across all disclosed midpoints (p25 to p75 of the mean of salary_min and salary_max) sat at $80,000 to $125,000 every week.
Disclosed pay readings, week by week:
| Week ending | Median floor | Median ceiling | Midpoint p25 | Midpoint p75 | Disclosed sample (n) |
|---|---|---|---|---|---|
| 5 Apr | $90,000 | $109,163 | $80,000 | $124,768 | 482 |
| 12 Apr | $90,000 | $110,000 | $81,000 | $125,000 | 787 |
| 19 Apr | $90,000 | $107,560 | $82,250 | $125,000 | 800 |
| 26 Apr | $90,600 | $110,000 | $85,000 | $135,000 | 784 |
| 3 May | $90,000 | $110,000 | $80,049 | $125,000 | 910 |
The interquartile range (p25 to p75 of midpoint) sat at roughly $45,000 every week, a remarkably narrow band for a 5,000-strong active pool. ANZ GTM pay distribution is flat: the gap between a 25th-percentile role and a 75th-percentile role on disclosed pay is about the cost of a midweight Marketing Manager.
A note on the methodology. We lead with median floor (median of salary_min) and median ceiling (median of salary_max) rather than the midpoint p50. The midpoint metric is mode-pinned at $100,000 because of two effects in the underlying data. First, 25% of disclosed bands have salary_min equal to salary_max (employers writing a single-point salary, often a round number). Second, the largest single midpoint cluster is at exactly $100,000. Floor and ceiling reported separately are the more informative pair.
What disclosed-band data does not capture: roles being eliminated quietly at the very high or very low end before they enter the disclosure cohort. The medians hold because the middle of the disclosed market holds, not because every role at every level pays the same as it did in March.
The senior layer collapsed
The cleanest signal of where the contraction landed is seniority. Mid-level roles (the largest single seniority cohort, covering most "Manager," "Senior X" and 3-7 year IC titles in the dataset) actually grew in absolute terms across April. The senior, lead and director cohort, taken as a block, fell by nearly two-thirds.
By seniority cohort, start-of-month → end-of-month active roles:
Mid is now the dominant remaining stock of the ANZ GTM market. The senior IC and first-line management band, taken together, lost more than 2,100 active roles in four weeks. Leadership reqs grew in absolute terms but the underlying counts are small (n=81 in the latest week, peaking near 200 in the week ending 26 April).
If you sit in the senior, lead or director band, the active req pool that fits your level shrank by nearly two-thirds in April. The most resilient market position from here is to package senior-level skill as leverage rather than personal output, since the roles still being created are mid-level or above-director.
Salary transparency: where it sits and why we are watching
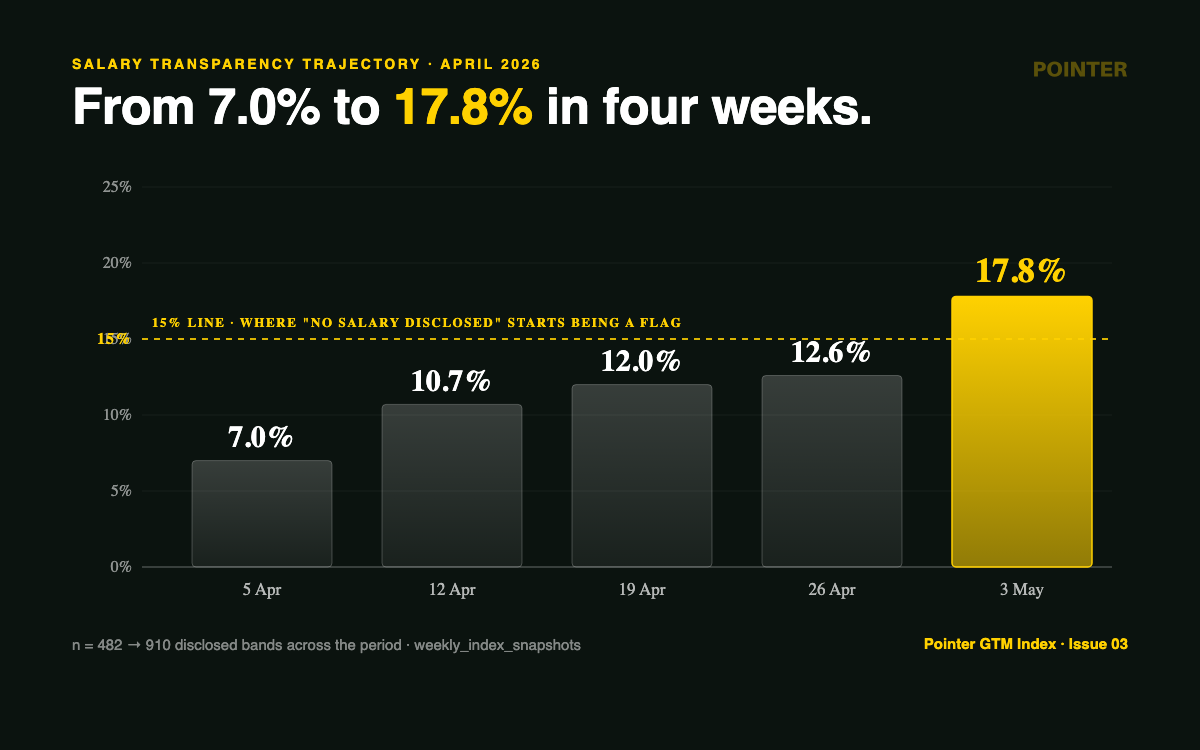
The 15% line matters because of how candidates behave when transparency reaches saturation. Below 10%, undisclosed pay is normal. Between 10% and 15%, it is awkward but tolerated. Above 15%, undisclosed pay reads as a flag. Most candidates we work with describe self-filtering out of unbanded roles once their inbox shows a disclosed alternative.
ANZ go-to-market hiring sits at 17.8% transparency in the latest week. We treat this as a current reading rather than a confirmed regime change. The trajectory:
The rate doubled. The disclosed sample also doubled while the total pool shrank, which means the move is not a sample-size artefact; if anything the underlying population is more transparent than the rate suggests. But the 5 April baseline reads roughly 3 percentage points lower than a steady-state estimate would (the disclosed-band cohort was very small that week), so the magnitude of the rise is partially flattered.
What we are confident about: ANZ GTM is currently more transparent on pay than it was in March, the move is real, and the trajectory is up. What we are not yet confident about: whether 17.8% holds for four consecutive weeks. If it does, we will call the threshold cleared. If it does not, the headline number for May becomes the watch line, not 15%.
The shift is market-wide, not function-led. Sales transparency moved 7.6% → 17.9%. Marketing 8.1% → 19.1%. Partnerships 5.0% → 18.8%. CS 7.4% → 18.7%. The simultaneous nature of the movement across every major function rules out a single advertiser's policy change driving the headline.
Geography: where the roles are
ANZ go-to-market hiring concentrates heavily in two cities. Snapshot of the latest reading (week ending 3 May, n=5,424):
| City / region | Active GTM roles | Share |
|---|---|---|
| Sydney | 1,630 | 30.1% |
| Melbourne | 1,204 | 22.2% |
| Brisbane | 486 | 9.0% |
| Perth | 321 | 5.9% |
| Adelaide | 183 | 3.4% |
| Auckland | 125 | 2.3% |
| Gold Coast | 101 | 1.9% |
| Regional QLD | 101 | 1.9% |
| Regional NSW | 100 | 1.8% |
| Other / unknown | 1,173 | 21.6% |
Melbourne climbed. Melbourne's share rose from 18.2% to 22.2% in four weeks, a four-point share gain. Sydney held its share inside a percentage point. Auckland weakened from 3.9% to 2.3%. Regional Australia (Regional NSW, Regional QLD, Gold Coast and smaller categories) collectively rose to roughly 6% of all active reqs, suggesting modest geographic diversification of GTM hiring even as the total pool tightened.
The disclosure split
The two disclosure trends in April moved in opposite directions. Salary disclosure rose. Location disclosure fell. Latest reading (3 May, n=5,424):
More than half of postings do not disclose a work model expectation, up from roughly a third earlier in the period. Among the postings that do disclose, remote-plus-hybrid is 49.0% (a near 50-50 split between in-person and flexible). Across all active roles, including undisclosed, remote-plus-hybrid is 22.7%, down from roughly 30% earlier in the period.
Two plausible explanations for the rise in undisclosed work model: employers withholding to avoid filtering out applicants, or contraction concentrating in industries where work model is set at company level rather than role level and not stated in the JD.
The headline contrast is the story. Pay disclosure is becoming the norm. Location disclosure is becoming the exception.
Agency share is rising
Recruitment-agency-posted listings as a share of the total active pool rose from 6.05% on 5 April to 7.6% on 3 May. The four-week trajectory was 6.05% → 6.0% → 5.5% → 6.3% → 7.6%, with the largest weekly move happening in the final week.
This Index excludes agency listings from function-level breakdowns to avoid distortion (agencies often anonymise the hiring company, and a single agency req can map to multiple JDs). But the share itself is informative. A rising agency share in a contracting market is consistent with internal talent acquisition capacity being thinned faster than the active req pool, with residual demand routed externally. The data here only shows the posting side of the market, not internal headcount, so we report this as a hypothesis to track rather than a confirmed pattern.
We will watch this as a leading indicator. If agency share holds above 7.5% through May the hypothesis strengthens.
What it means
For GTM individual contributors at the senior, lead or director level. This cohort is most affected by April's shape. The active req pool that fits this band shrank by nearly two-thirds in four weeks. The roles still being created skew mid-level or above-director. The most resilient market position from here is to package senior-level skill as leverage rather than personal output. Roles framed around lifting other people's numbers (deal coaching, ramp programs, playbook ownership, manager paths) are the rare positives in the data.
For hiring managers running ANZ GTM teams. Three operational implications, framed against what the data does and does not show. One: the salary transparency rate sits at 17.8% and is rising. Reqs that do not disclose a band are now in the minority among postings within reach of a candidate's salary-filtered search. Two: the active CS req pool collapsed by nearly two-thirds. The pipeline of CS candidates entering the market from those closed roles is not directly observable in this dataset, but the supply-demand balance for hiring managers with a CS req open looks more favourable now than at any point in the dataset. Three: if your senior-level req has been open more than 30 days, the dataset suggests applicant flow at this level is unusually high, so the long open is more plausibly a comp-band or req-language issue than a candidate-pool issue.
For founders thinking about GTM hiring sequence. The data endorses a more conservative sequence. Hire a strong Head of Sales early. Resist the pressure to build out a full IC layer until pipeline forces it. The market is currently rewarding lean, leverage-shaped GTM orgs and punishing breadth-first scaling. If you must hire an IC, hire entry-level (the supply is there at $80k–$95k base) or hire one specialist senior IC (the supply is there at $115k–$135k base). The middle is where employers are losing money in 2026.
For press and analysts. The April 2026 data is consistent with several hypotheses. (a) An ANZ-specific Q2 budget reset following softer Q1 performance. (b) An anticipatory move by employers ahead of expected pay-disclosure regulation. (c) A cyclical re-rating of GTM cost structures driven by software-spend reviews. The data does not yet distinguish between these. May data should. Specifically, watch: openings-to-closures ratio (currently 0.78), function-level transparency convergence (whether all functions reach roughly 20% within two weeks), and whether the active-roles total breaks below 5,000 sustainably.
Watch list for May
One. Salary transparency rate. Currently 17.8%. If it holds above 15% for four consecutive weeks we will call the threshold cleared and shift the next watch line to 25%.
Two. Openings-to-closures ratio. Currently 0.78 in the latest week. A reading above 1.0 for two consecutive weeks would mark the end of the clearance phase. A reading below 0.7 in May would mark the deepest sustained ANZ GTM contraction since continuous ingestion began.
Three. Sales + Marketing share of all GTM reqs. Currently 84.1%. If it sustains above 80% in May, the consolidation into the two largest functions is the durable structural story of 2026.
Four. Agency share. Currently 7.6%. Above 7.5% sustained signals internal recruiting capacity is being thinned faster than the req pool.
Hire ANZ GTM talent with Pointer Strategy
Pointer Strategy places sales, marketing, customer success, RevOps, enablement, and partnerships leaders across Australia and New Zealand. Every search is informed by the same data feed that powers The Pointer Index. If your senior-level req has been open more than 30 days in this market, that is a comp-band or positioning issue, not a candidate-pool issue, and we can help.