This is the most comprehensive compensation benchmark ever published for partnership professionals in the Asia-Pacific region.
The 2026 APAC Partnerships Salary Survey, produced by Hockey Stick Advisory in collaboration with Pointer Strategy, with data enrichment from Firmable, collected anonymised compensation and career data from over 200 partnership professionals across Australia, New Zealand, Singapore, and Malaysia.
This report covers everything: base salary, commissions, bonuses, equity, benefits, work arrangements, job satisfaction, mobility intentions, and team growth — segmented by role level, company stage, industry, and region.
How this report is structured: Key findings and headline data are freely available. Detailed breakdowns by company stage, industry, region, and variable compensation are from the Comprehensive Report — contact our partnership recruitment team to access the full data.
Key Findings at a Glance
| Finding | Data |
|---|---|
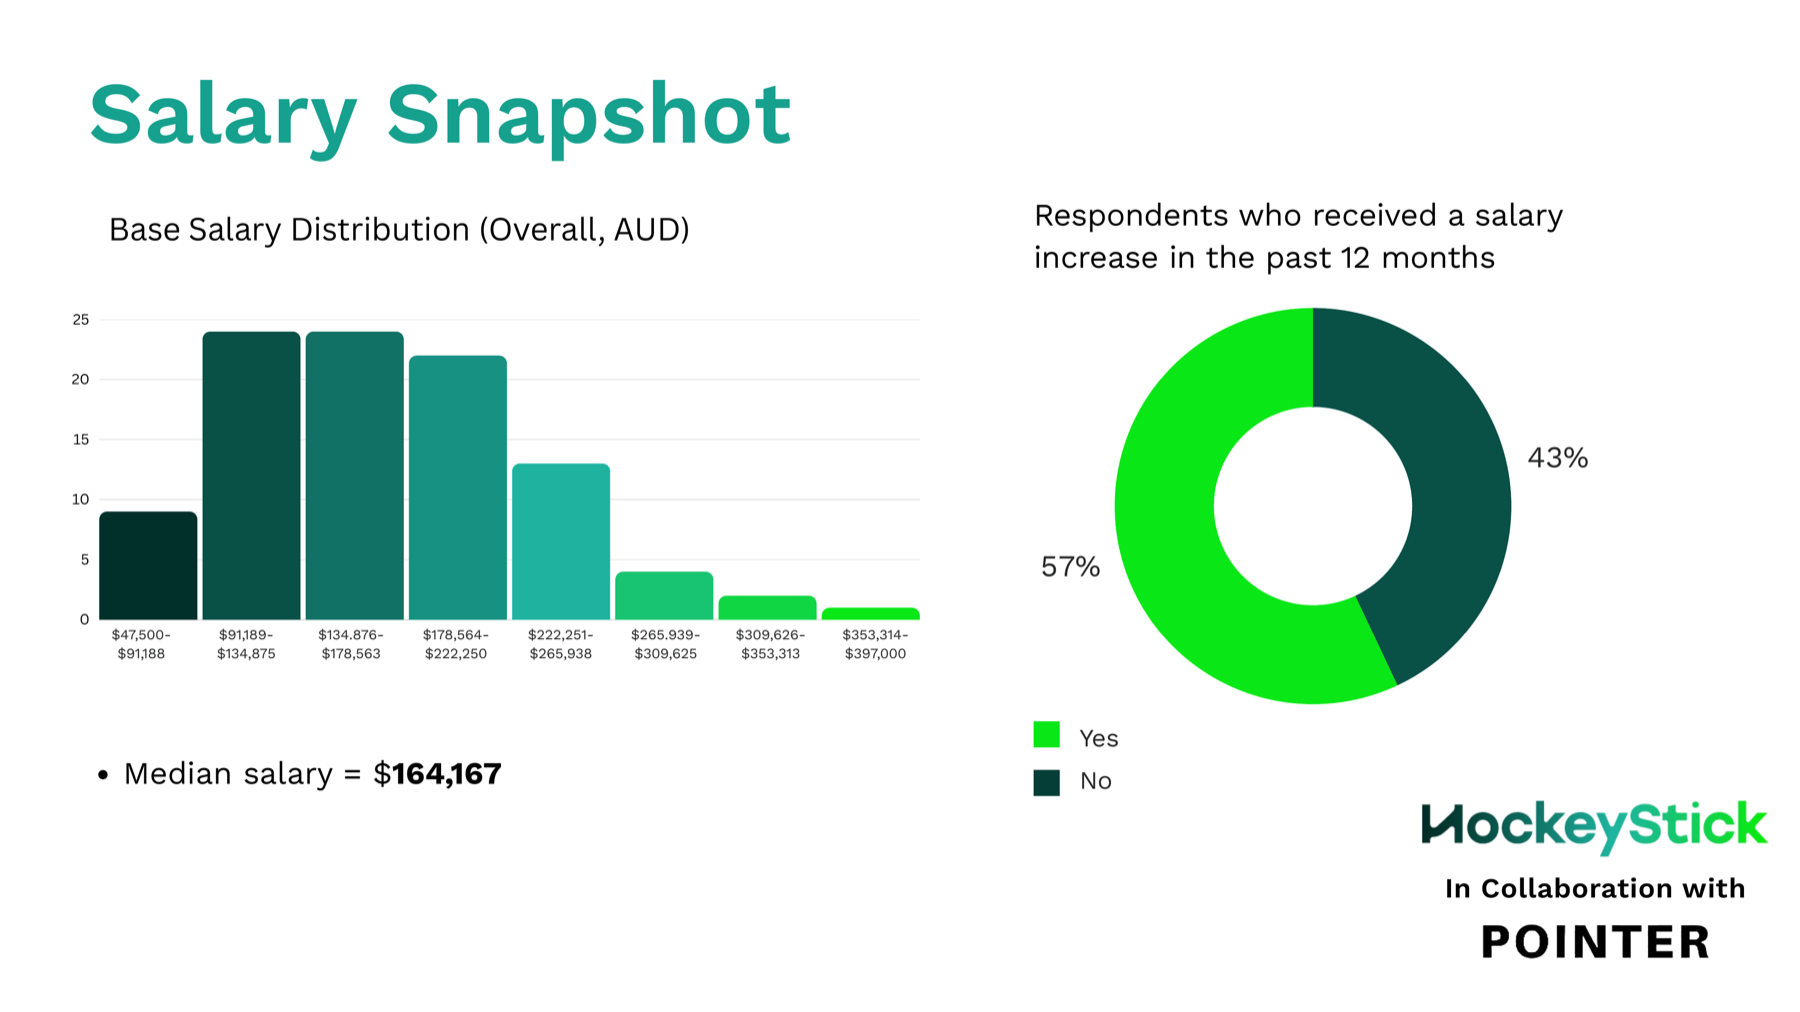
| Median base salary | $164,167 AUD |
| Salary range | $47,500 – $397,000 AUD |
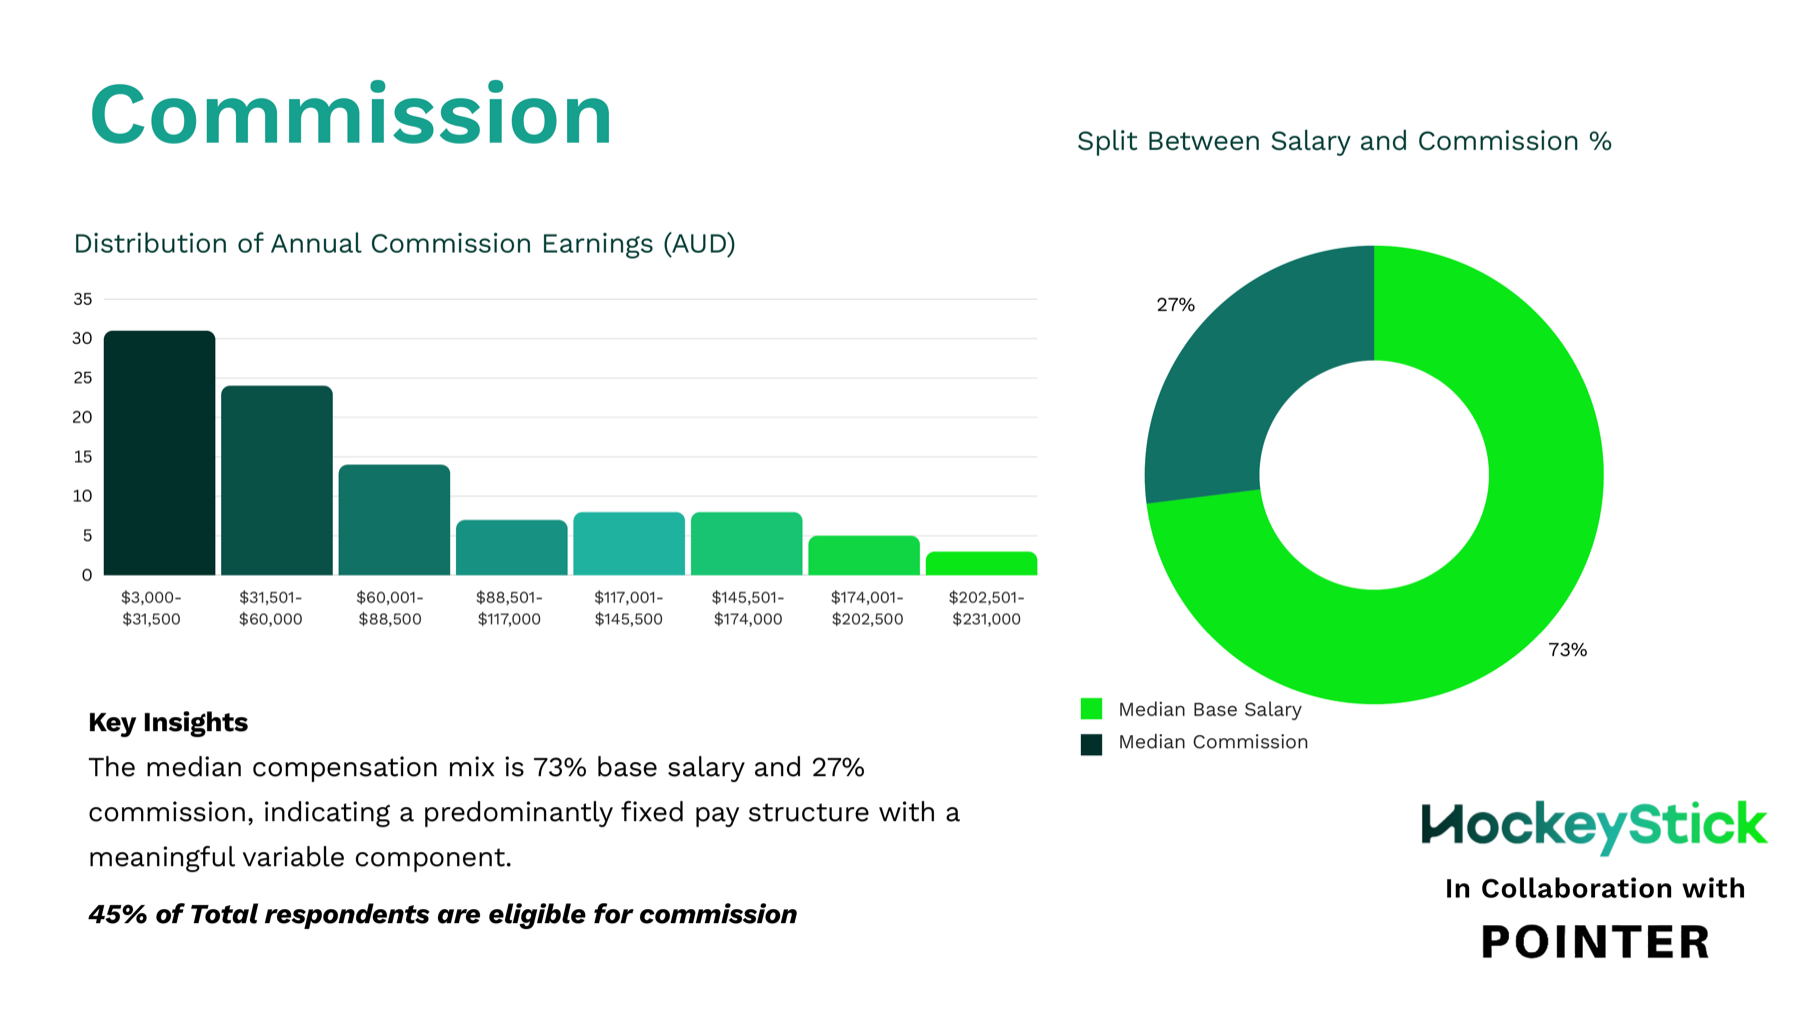
| Median compensation split | 73% base salary / 27% commission |
| Commission eligibility | 45% of respondents |
| Bonus eligibility | 52% of respondents |
| Received salary increase (last 12 months) | 43% |
| Open to changing roles (next 12 months) | 73% |
| Partnership teams that grew (last 12 months) | 46% |
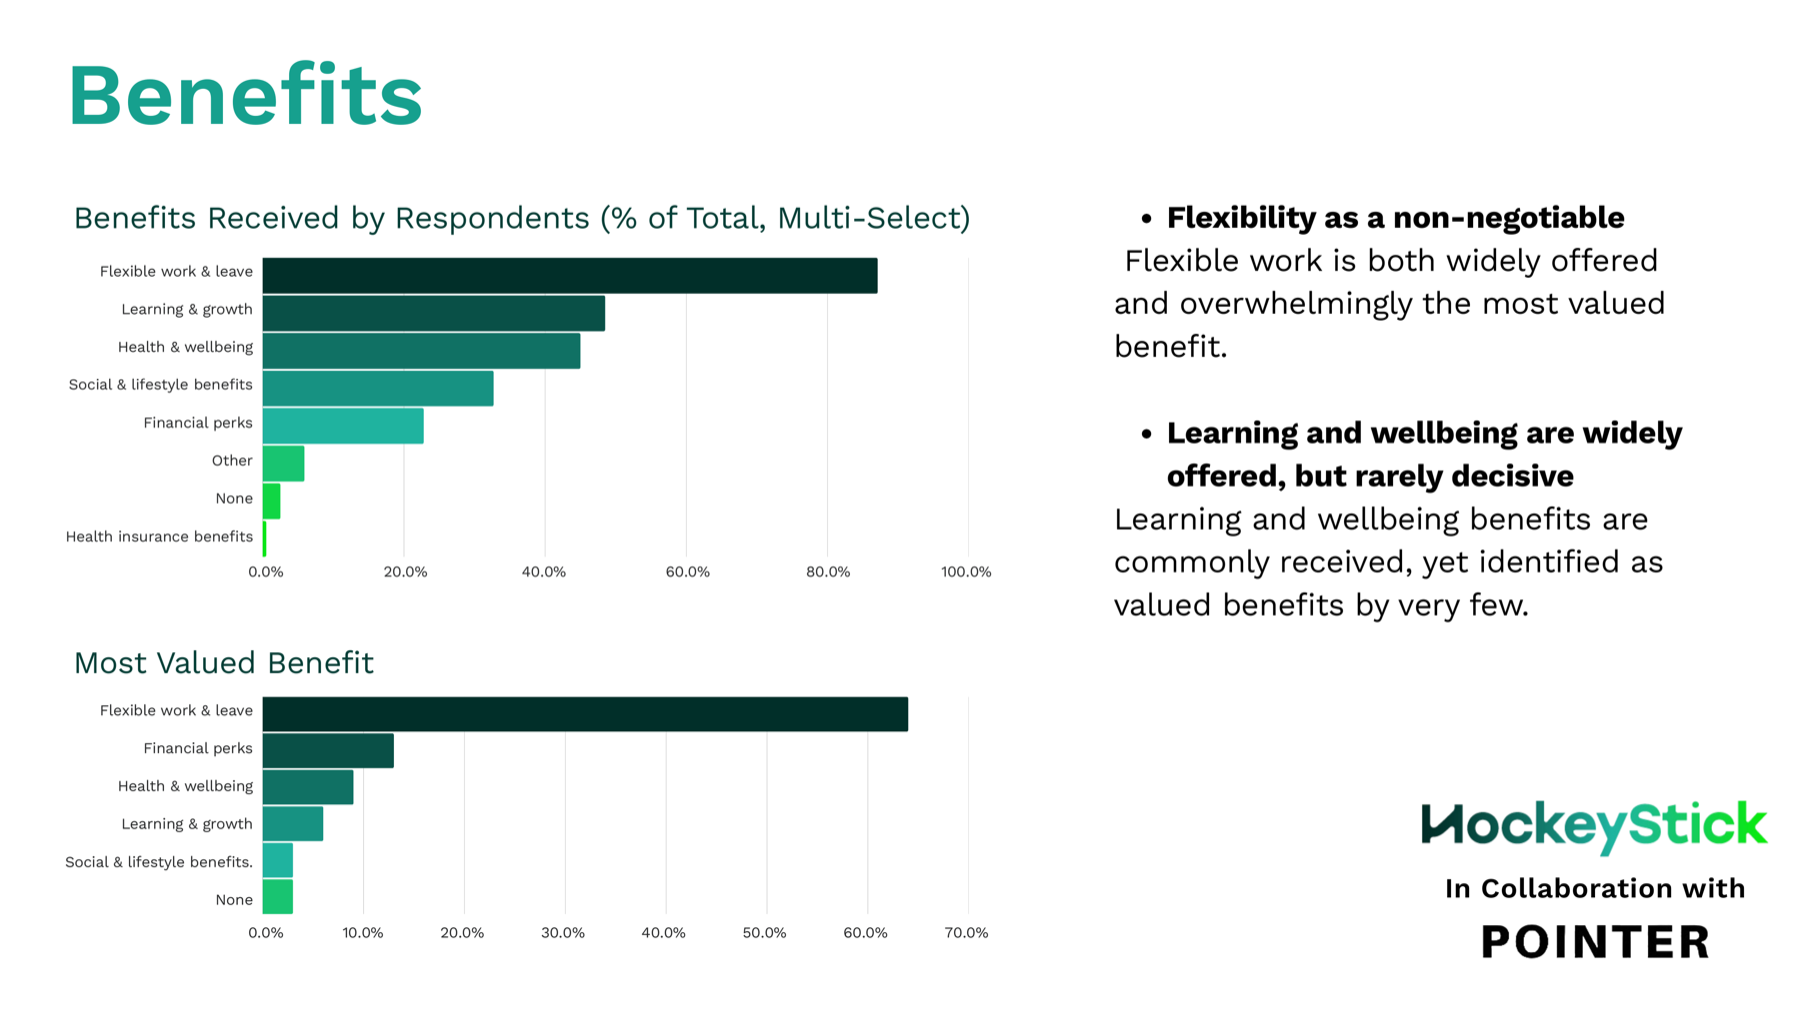
| Most valued benefit | Flexible work & leave (64%) |
| Total partnership roles across APAC | 21,518 |
| Fastest-growing related role in Australia | Strategic Partnerships Manager (#15 on LinkedIn) |
How Much Do Partnership Professionals Earn in APAC?
The median base salary for partnership professionals across APAC is $164,167 AUD. The middle 50% of respondents earn between $120,000 and $205,451, with the full range extending from $47,500 to $397,000.
The distribution is concentrated in the $91K–$222K range, with a meaningful tail at the top end — particularly for revenue-adjacent roles at enterprise companies.
| Percentile | Base Salary (AUD) |
|---|---|
| Minimum | $47,500 |
| 25th percentile | $120,000 |
| Median | $164,167 |
| 75th percentile | $205,451 |
| Maximum | $397,000 |
Among respondents who receive both base salary and commission, the median compensation mix is 73% base salary and 27% commission, indicating a predominantly fixed pay structure with a meaningful variable component. For regularly updated benchmarks beyond this annual survey, view live partnership salary data on Pointer Market Data.
43% of respondents received a salary increase in the past 12 months. Despite this, 73% remain open to changing roles — signalling that salary increases alone are not enough to drive retention.
Partnership Salary by Role Level
Role level is the single strongest predictor of base salary. For the first time in APAC, clear mid-senior salary banding is forming.
| Role Level | Median Base Salary (AUD) |
|---|---|
| Director of Partnerships | $222,500 |
| VP / Head of Partnerships | $185,000 |
| Senior Manager (Strategic Partnerships) | $160,000 |
| Partnerships Manager & Revenue-Owning ICs | $121,800 |
The gap between a Partnerships Manager ($122K) and a Director ($222K) is $100K in base salary alone. Senior Managers, VPs, and C-suite roles cluster tightly within the $170K–$185K band, suggesting that the premium for moving from Senior Manager to VP is modest compared to the jump from Manager to Senior Manager.
For a detailed breakdown of how role-level compensation differs across company stages, read Partnership Compensation by Company Stage.
How Does Company Stage Affect Partnership Compensation?
Company stage materially affects what partnership professionals earn. Each stage has a distinct compensation profile and risk-reward trade-off.
| Metric | Startup (1–100) | Scaleup (100–500) | Enterprise (500–1,000+) |
|---|---|---|---|
| Salary range | $61,520–$240,000 | $47,500–$330,000 | $50,000–$397,000 |
| Median salary | ~$140,000 | $143,750 | $185,000 |
| Median commission | $46,500 | $30,000 | $90,000 |
| Median bonus | $21,500 | $25,000 | ~$28,000 |
| Median equity | $12,000 | $100,000 | $40,000 |
| Bonus eligibility | 40% | 47% | 53% |
The progression is clear: enterprises pay the highest base and commissions, scaleups offer the strongest equity, and startups compensate with growth upside and flexibility.
Startup Compensation in Detail (1–100 Employees)
Startups offer moderate base pay with significant upside through equity, flexible work, and growth opportunities. Benefits packages are less comprehensive than in larger organisations.
The most common salary band is $121,281–$150,960 (26% of startup respondents). 40% of startup employees are eligible for bonuses, with a median bonus of $21,500 and median commission of $46,500 — higher than scaleups, reflecting that early-stage partnership roles often carry direct revenue targets.
Startup equity has a median of $12,000 but outliers reach up to $1,000,000, highlighting significant potential upside. Startups show the strongest salary growth optimism: 19% rated themselves "very optimistic" — the highest proportion of any company stage.
Key startup compensation trends:
Scaleup Compensation in Detail (100–500 Employees)
Scaleups offer higher base salaries and equity than startups, with moderate incentives. The heaviest salary concentration is in the $94,584–$141,667 band (41% of scaleup respondents).
Scaleup median equity is $100,000 — significantly higher than both startups and enterprises, ranging from $17,200 to $200,000. Median commission is $30,000, lower than startups, suggesting scaleup partnership roles are less directly tied to individual revenue targets.
Scaleups are the most cautious cohort: 44% rated "neutral" on salary growth optimism, with only 6% "very optimistic." This may reflect the squeeze between startup agility and enterprise resources.
Key scaleup compensation trends:
Enterprise Compensation in Detail (500–1,000+ Employees)
Enterprises pay the most across every dimension. The heaviest salary concentration is in the $165,668–$223,500 band (33%), with 23% earning between $223,501 and $281,333 — a premium tier that barely exists at startups or scaleups.
Enterprise median commission is $90,000 — 3x the scaleup median — with a range extending to $450,000 for revenue-generating roles. Median equity is $40,000, but maximum holdings reach $1,200,000, indicating selective high-value grants at senior levels.
Enterprise respondents show moderate-to-high salary growth optimism, supported by the highest median salaries and broadest bonus/equity offerings.
Enterprise benefits are significantly more comprehensive:
| Benefit | Enterprise | Scaleup | Startup |
|---|---|---|---|
| Flexible work & leave | 45.0% | 14.9% | 27.2% |
| Health & wellbeing | 30.7% | 6.9% | 7.4% |
| Learning & growth | 28.2% | 8.4% | 11.9% |
| Social & lifestyle | 16.8% | 5.9% | 9.9% |
| Financial perks | 14.4% | 3.5% | 5.0% |
Premium Report Data
Detailed benchmarks from the 2026 APAC Partnerships Salary Survey Comprehensive Report. Talk to our partnership team to access the full data.
Contact Us for the Full ReportFor the full company stage analysis with detailed distributions and trade-off guidance, read Partnership Compensation: Startup vs Scaleup vs Enterprise.
Partnership Salary by Industry
Manufacturing and Industrial leads the pack — challenging the assumption that tech always pays the most for partnership roles.
| Industry | Median Base Salary (AUD) |
|---|---|
| Manufacturing/Industrial | $188,500 |
| Technology (SaaS/Software) | $170,000+ |
| Fintech/Financial Services | $165,000+ |
| Professional Services | $155,000+ |
Financial Services has unexpectedly overtaken Tech as the primary driver of partnership job posts in the region, signalling a broadening of the function beyond its traditional SaaS roots.
Bonus by Industry
| Industry | Median Bonus (AUD) |
|---|---|
| Fintech/Financial Services | $34,600 |
| Technology (SaaS/Software) | $30,000 |
| Professional Services | $25,000 |
| Manufacturing/Industrial | $18,654 |
Commission by Industry
| Industry | Median Commission (AUD) |
|---|---|
| Technology (SaaS/Software) | $75,000 |
| Fintech/Financial Services | $40,000 |
| Media/Marketing/Entertainment | $12,795 |
Tech SaaS partnership roles command the highest commissions by a significant margin, reflecting the revenue-generating nature of technology partnerships.
Premium Report Data
Detailed benchmarks from the 2026 APAC Partnerships Salary Survey Comprehensive Report. Talk to our partnership team to access the full data.
Contact Us for the Full ReportPartnership Salary by Region
Partnership professionals with APAC-wide scope earn the most, reflecting the complexity and strategic importance of cross-market roles.
| Region/Remit | Median Base Salary (AUD) |
|---|---|
| APAC scope | $177,500 |
| ANZ scope | $165,000+ |
| Single market | $150,000+ |
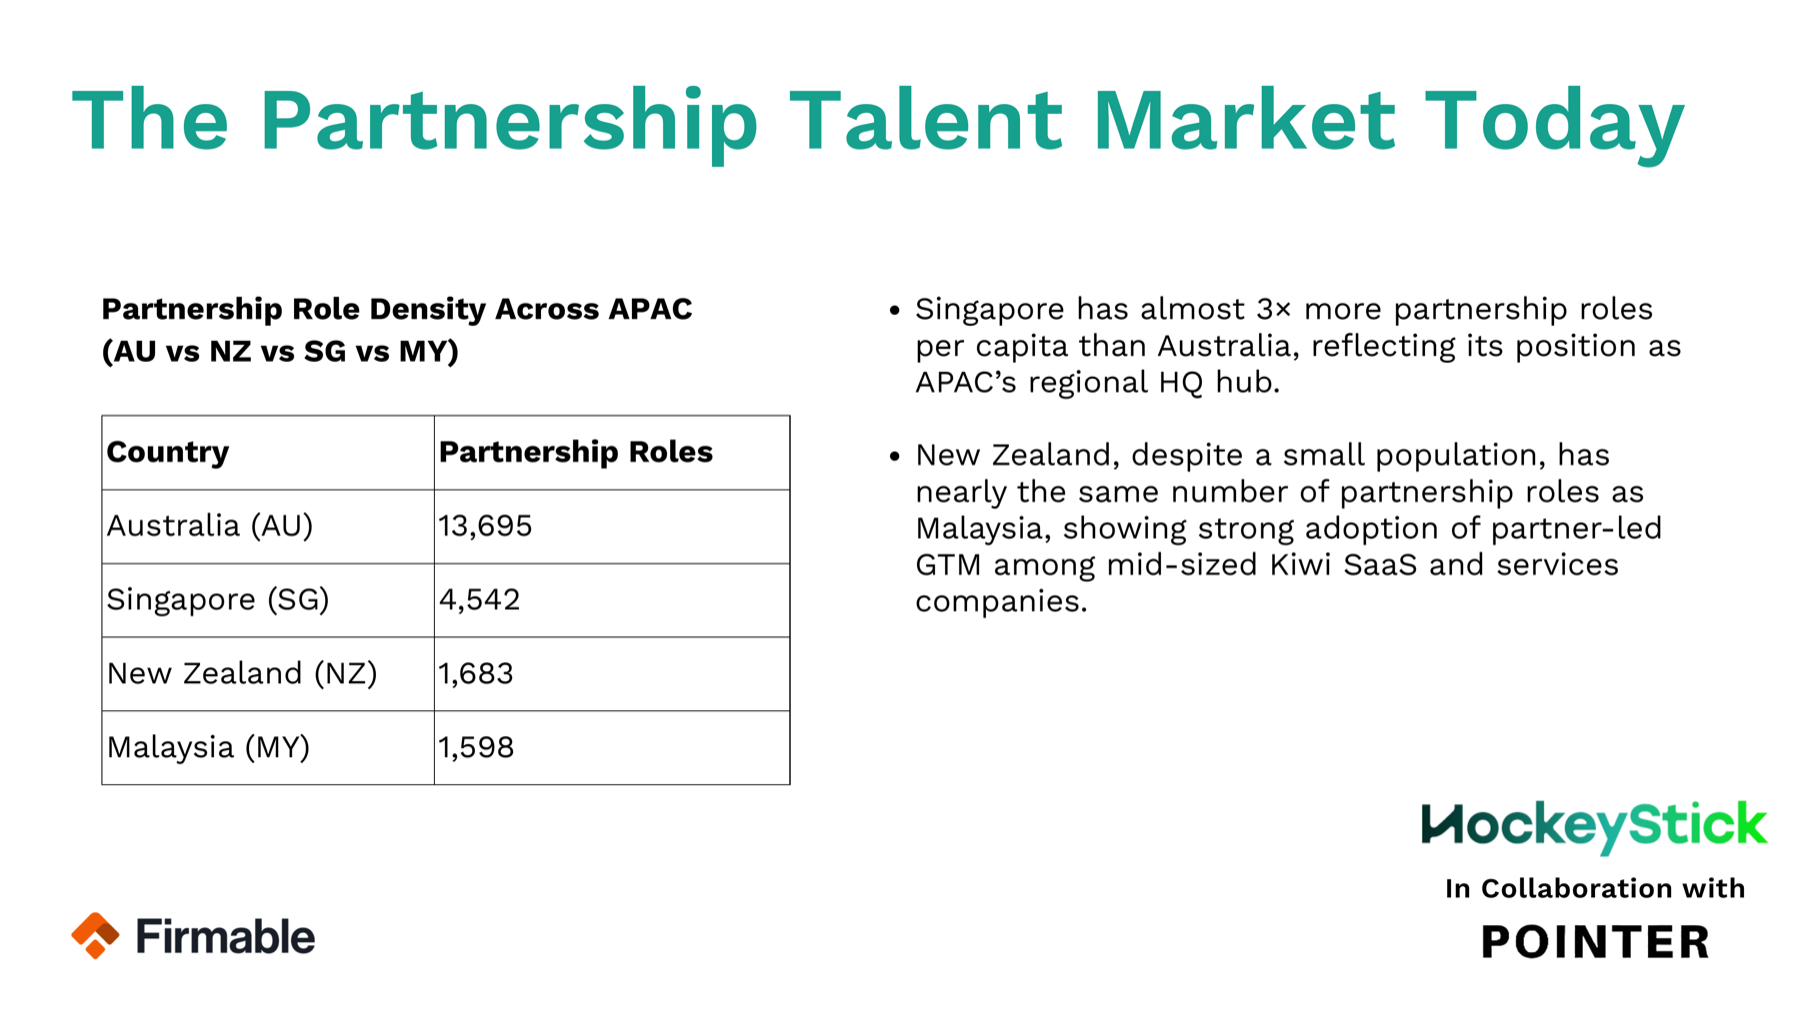
Partnership Role Density Across APAC
| Country | Partnership Roles |
|---|---|
| Australia | 13,695 |
| Singapore | 4,542 |
| New Zealand | 1,683 |
| Malaysia | 1,598 |
Singapore has almost 3x more partnership roles per capita than Australia, reflecting its position as APAC's regional HQ hub. New Zealand, despite a smaller population, has nearly the same number of partnership roles as Malaysia — showing strong adoption of partner-led GTM among mid-sized Kiwi SaaS and services companies.
Premium Report Data
Detailed benchmarks from the 2026 APAC Partnerships Salary Survey Comprehensive Report. Talk to our partnership team to access the full data.
Contact Us for the Full ReportWhat Commission and Bonus Do Partnership Professionals Earn?
45% of partnership professionals receive commissions. 52% are eligible for bonuses. Here is the full variable compensation picture.
Commission by Role Level
| Role Level | Median Commission (AUD) |
|---|---|
| Director | $130,000 |
| VP / Head of Partnerships | $80,000 |
| Senior Manager | $50,000 |
| Partnerships Manager | $50,000 |
| Associate/Analyst | $30,000 |
| C-Suite | $43,000 |
The majority of commission earners (56%) earn between $2,000 and $114,750 annually. Higher-end commissions above $145K are rare, concentrated in Director-level and revenue-critical enterprise roles.
Bonus by Role Level
| Role Level | Median Bonus (AUD) |
|---|---|
| C-Suite | $43,000 |
| VP / Head of Partnerships | $40,000 |
| Director | $38,000 |
| Senior Manager | $25,000 |
| Partnerships Manager | $20,000 |
| Associate/Analyst | $12,869 |
Bonus payouts are concentrated in the $1,000–$35,000 range. High-value bonuses above $69K are limited to senior or revenue-critical roles. The distribution reflects a conservative bonus structure with broad coverage at modest levels and selective allocation of larger awards.
Equity Compensation
40% of partnership professionals receive equity. 54% have no equity at all. 6% are unsure.
| Equity Range (AUD) | % of Equity Holders |
|---|---|
| $1,000–$25,875 | 48% |
| $25,876–$50,750 | 20% |
| $50,751–$75,625 | 9% |
| $75,626–$100,500 | 9% |
| $100,501–$125,375 | 3% |
| $125,376–$150,250 | 6% |
| $150,251–$175,125 | 1% |
| $175,126–$200,000 | 4% |
Nearly half of equity holders (48%) hold grants in the $1,000–$25,875 range, primarily in startups. Higher allocations above $100K (14%) are largely in enterprise companies. Scaleup equity ($25,876–$50,750) sits in the middle.
On-Target Earnings (OTE)
OTE combines base salary, bonus, and commission into the total compensation picture.
| OTE Range (AUD) | % of Respondents |
|---|---|
| $26,000–$79,500 | 4% |
| $79,501–$133,000 | 18% |
| $133,001–$186,500 | 26% |
| $186,501–$240,000 | 24% |
| $240,001–$293,500 | 10% |
| $293,501–$347,000 | 5% |
| $347,001–$400,500 | 8% |
| $400,501–$454,000 | 5% |
| $454,001–$507,500 | 1% |
| $507,501–$561,000 | 1% |
50% of respondents report OTE between $133,001 and $240,000, forming the core compensation band. Only 4% earn below $79,500. Higher-end compensation is uncommon: just 7% exceed $347,000 and only 2% exceed $454,000.
Premium Report Data
Detailed benchmarks from the 2026 APAC Partnerships Salary Survey Comprehensive Report. Talk to our partnership team to access the full data.
Contact Us for the Full ReportWhat Benefits Do Partnership Professionals Value Most?
Flexibility has become a baseline expectation — and the strongest differentiator in partnership roles.
| Benefit | % Received | % Most Valued |
|---|---|---|
| Flexible work & leave | 87.1% | 64% |
| Learning & growth | 48.5% | 6% |
| Health & wellbeing | 45.0% | 9% |
| Social & lifestyle | 32.7% | 3% |
| Financial perks | 22.8% | 13% |
The gap between "received" and "valued" is telling. Learning and wellbeing benefits are widely offered but rarely decisive. Flexibility is both ubiquitous and overwhelmingly the most valued — it has become a non-negotiable.
Work Arrangements
| Arrangement | % of Respondents |
|---|---|
| Hybrid (2–3 days in office) | 55% |
| Fully remote | 31% |
| Mostly in-office (4–5 days) | 9% |
| Fully in-office | 4% |
The workforce is primarily hybrid or remote. Job satisfaction is highest where flexibility is structured — hybrid arrangements show the strongest satisfaction profile overall, while fully in-office roles show the most polarisation.
How Satisfied Are Partnership Professionals?
Overall job satisfaction is high, with 74.2% rating themselves satisfied or very satisfied.
| Rating | % of Respondents |
|---|---|
| 5 — Very satisfied | 26.7% |
| 4 — Satisfied | 47.5% |
| 3 — Neutral | 21.8% |
| 2 — Dissatisfied | 3.5% |
| 1 — Very dissatisfied | 0.5% |
Satisfaction by Work Arrangement
Satisfaction profiles vary significantly by work arrangement:
The key insight: Satisfaction improves as flexibility increases, particularly when flexibility is structured rather than absolute. Hybrid work delivers the most consistent positive experience.
Premium Report Data
Detailed benchmarks from the 2026 APAC Partnerships Salary Survey Comprehensive Report. Talk to our partnership team to access the full data.
Contact Us for the Full ReportIs the Partnership Talent Market Growing?
Partnerships have moved into the mainstream. According to data from Firmable, there are 21,518 partnership roles across APAC — and the number is growing.
| Company Size (Global Employees) | Partnership Roles |
|---|---|
| 1–10 | 1,613 |
| 11–50 | 3,343 |
| 51–250 | 4,046 |
| 251–500 | 1,734 |
| 501–1,000 | 1,685 |
| 1,001–5,000 | 3,910 |
| 5,001–10,000 | 1,668 |
| 10,001+ | 3,519 |
Nearly a quarter of all partnership roles are in companies with fewer than 50 employees. Partner-led growth is no longer just an enterprise strategy.
Strategic Partnerships Manager has climbed to the #15 fastest-growing role in Australia for 2026 on LinkedIn. The median years of prior experience is 8.3 years, the gender split is 45.75% female / 54.25% male, and 50% of roles offer hybrid work.
The Most Common Partnership Titles in APAC
Manager-level roles dominate the ecosystem. The function skews execution-heavy, suggesting most companies are still early in formalising structured partner programs.
Where Partnership Professionals Come From
| Previous Function | % of Partnership Professionals |
|---|---|
| Sales | 52% |
| Other | 17% |
| Customer Success | 16% |
| Marketing | 14% |
The talent pipeline is overwhelmingly sales-led. The top roles people transition from are Business Development Manager, Account Manager, and General Manager.
For the full talent market analysis, read Partnership Talent Market APAC: 21K Roles, 73% Flight Risk.
Why Are 73% of Partnership Professionals Open to Leaving?
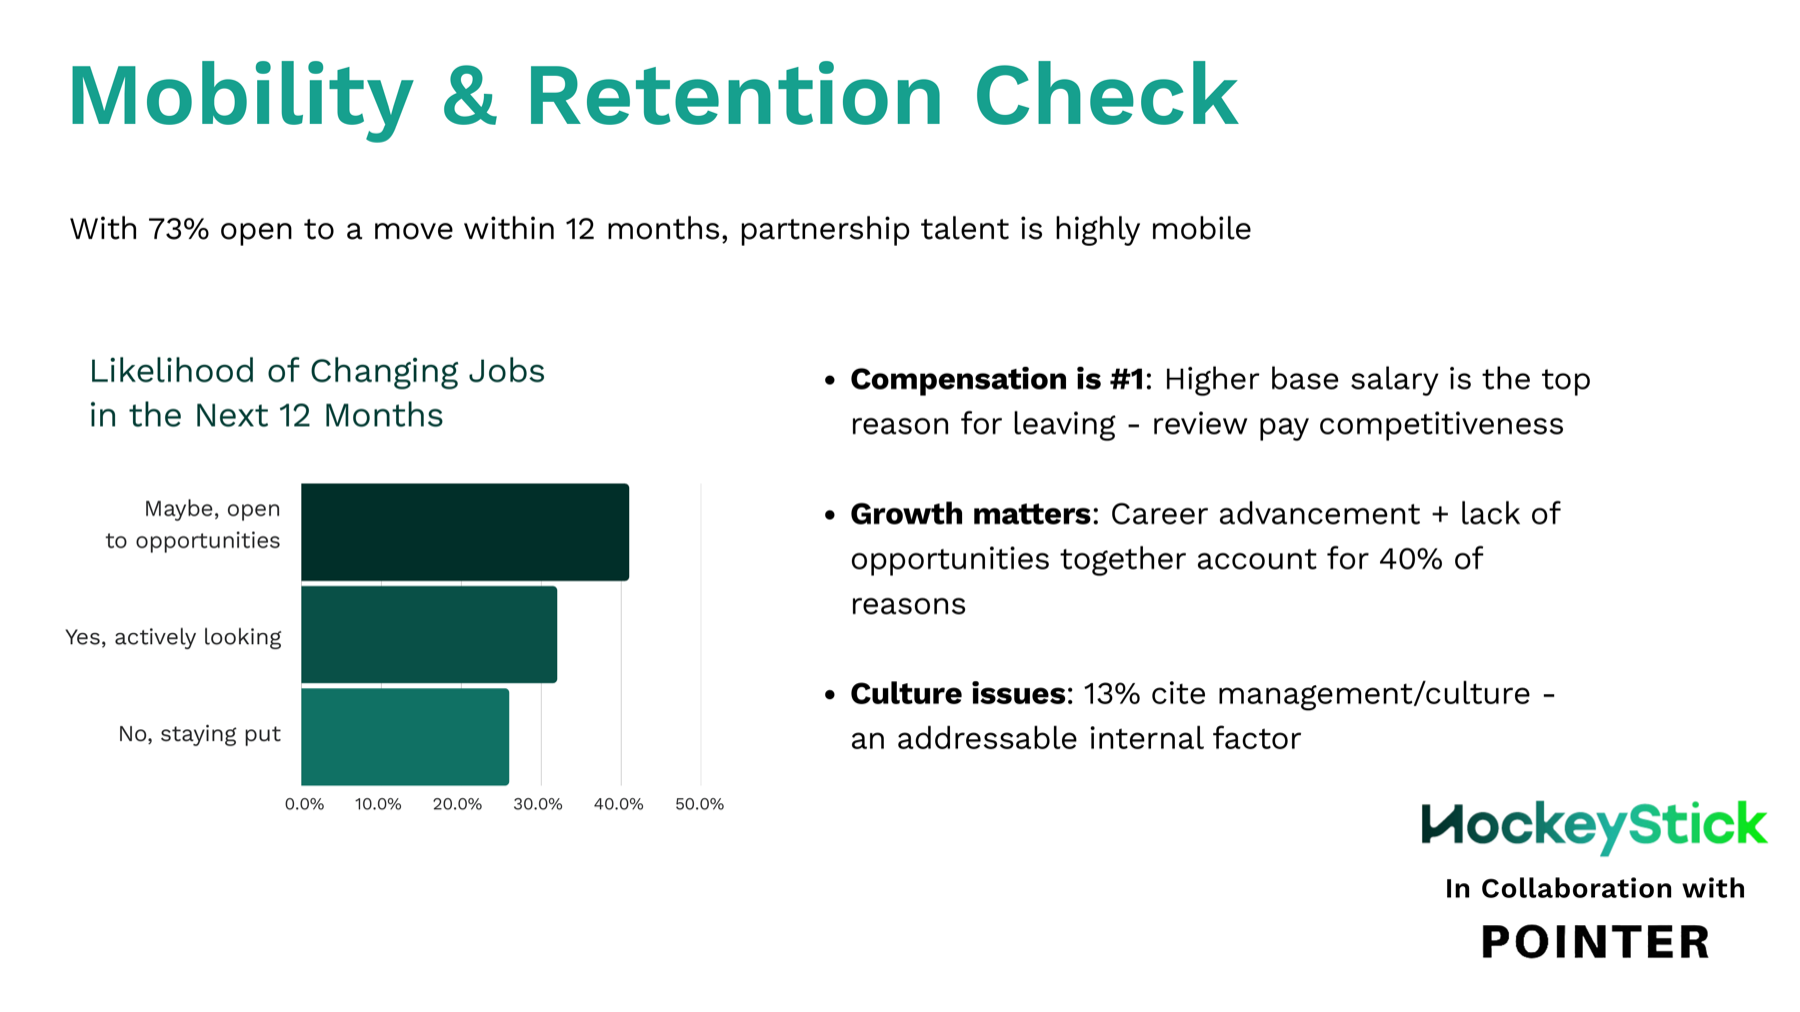
73% of partnership professionals are open to changing roles within the next 12 months. This is the defining challenge of the partnership talent market.
| Likelihood of Changing Jobs | % |
|---|---|
| Maybe, open to opportunities | 41% |
| Yes, actively looking | 32% |
| No, staying put | 26% |
Why People Leave
| Reason | % |
|---|---|
| Higher base salary | 32% |
| Career advancement / promotion | 26% |
| Lack of growth opportunities | 14% |
| Company culture or management | 13% |
| Other reasons | 11% |
| Better bonus / commission | 3% |
Compensation is number one. But career growth is arguably the bigger strategic lever — career advancement and lack of growth opportunities together account for 40% of reasons people leave. That's addressable. Base salary requires budget. Career pathways require design.
Directors Are the Highest Flight Risk
48% of Directors are actively looking for new roles — the highest of any level. The largest tenure cohort across all levels is 1–2 years. After investing 6–12 months getting a senior partnership hire productive, there's a meaningful probability they're already thinking about their next move.
Partnership Team Growth by Company Stage
Despite high mobility, companies are investing — not retreating.
| Company Stage | Grown | Remained the Same | Shrunk |
|---|---|---|---|
| Enterprise | 50% | 29% | 21% |
| Scaleup | 47% | 31% | 22% |
| Startup | 39% | 52% | 10% |
Partnership hiring peaks around mid-year — likely aligned to new FY budgets — and then stabilises through Q3–Q4. This isn't project-based hiring. This is long-term capability building.
Are Companies Confident in Scaling Partnerships?
| Confidence Level | % |
|---|---|
| Very confident | 7% |
| Confident | 57.2% |
| Neutral | 22.1% |
| Not very confident | 11.6% |
Only 7% are very confident. The majority sit in the "on track but could improve" camp. The barriers: lack of dedicated resources, partnerships managed as a secondary function, and poor internal alignment. Companies with structured processes and PRM tools report higher confidence.
Expert Perspectives
Bryan Williams, Founder, Hockey Stick Advisory:
"The era of 'accidental' partnerships is over. Yet as the function matures, a paradox has emerged: while hiring is at an all-time high, the strategy, structure, and clarity required to make these roles successful often lag behind. To unlock true growth, leaders must move beyond transactional hiring and embrace a rigorous system like the Hockey Stick Partnerships Framework."
Hugo Bieber, Head of Partnership Recruitment, Pointer Strategy:
"A capable mid-level hire, executing against a well-designed strategy, with structured enablement and a clear growth path, consistently outperforms a more expensive senior hire who is left to figure everything out alone. The companies that build their partnership functions this way tend to move faster, retain better, and spend less. It's not about hiring cheaper. It's about building smarter."
Employer Checklist: Is Your Compensation Competitive?
Employee Checklist: Are You Being Compensated Fairly?
Premium Report Data
Detailed benchmarks from the 2026 APAC Partnerships Salary Survey Comprehensive Report. Talk to our partnership team to access the full data.
Contact Us for the Full ReportWhat Should Employers Do With This Data?
If you're building or scaling a partnership team in 2026, four things matter:
1. Get base salary right first. Higher base salary is the #1 reason partnership professionals leave. Variable comp adds upside, but rarely compensates for under-market base pay. Benchmark against the role-level medians in this report.
2. Flexibility is table stakes. 87% already receive it. 64% call it their most valued benefit. If you're not offering hybrid or remote options, you're competing with one hand tied behind your back.
3. Build career pathways before you need them. Career advancement (26%) and lack of growth (14%) together account for 40% of reasons people leave. A clear progression blueprint — mapped to specific capabilities and milestones — reduces the 73% flight risk.
4. Consider strategy before seniority. A Partnerships Manager at $122K with a proven strategic framework can outperform a Director at $222K who's expected to build strategy and execute simultaneously. Read How to Hire Partnership Professionals the Smart Way for the full model.
Methodology
The 2026 APAC Partnerships Salary Survey was conducted by Hockey Stick Advisory in collaboration with Pointer Strategy, with data enrichment from Firmable.
All salary figures are reported in Australian Dollars (AUD). Respondents provided anonymised data.
Related Reports and Analysis
This benchmark report is supported by five detailed analyses, each exploring a specific dimension of the data:
Frequently Asked Questions
Get the Full Comprehensive Report
This benchmark presents key findings from the APAC Partnerships Salary Survey. The Comprehensive Report goes deeper with:
To access the full report or discuss partnership hiring benchmarks for your team, contact us.
*The 2026 APAC Partnerships Salary Survey was produced by Hockey Stick Advisory in collaboration with Pointer Strategy, with data enrichment from Firmable.*